Antrodia cinnamomea extract inhibits the proliferation of tamoxifen-resistant breast cancer cells through apoptosis and skp2/microRNAs pathway
Abstract
Figures 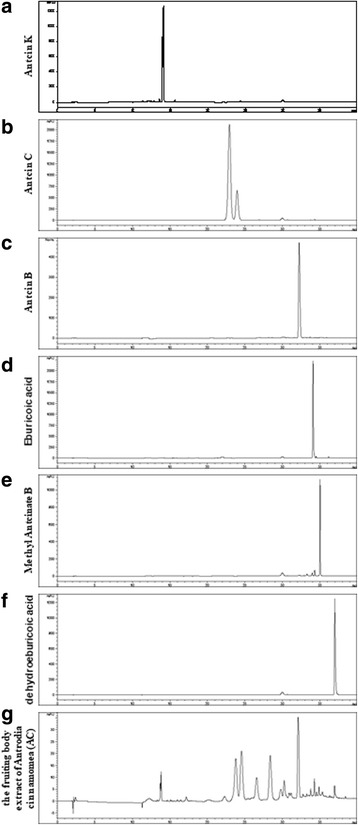
Fig. 1
HPLC chromatograms of antcin K…
Fig. 1
HPLC chromatograms of antcin K ( a ), antcin C ( b ),…
Fig. 1 HPLC chromatograms of antcin K (a), antcin C (b), antcin B (c), eburicoic acid (d), methyl antcinate B (e), dehydroeburicoic acid (f) and the extract of Antrodia cinnamomea (AC) (g)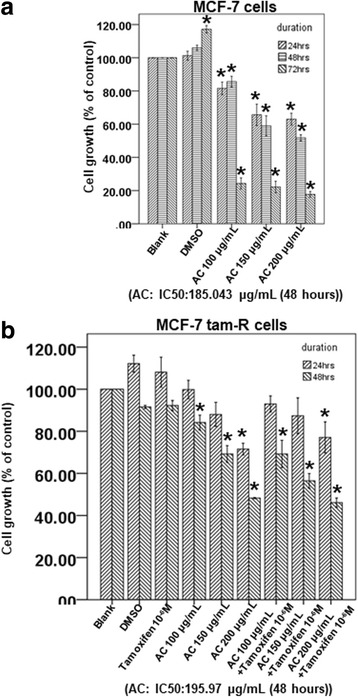
Fig. 2
AC block the proliferation of…
Fig. 2
AC block the proliferation of breast cancer cell lines. MCF-7 cells (a) or…
Fig. 2 AC block the proliferation of breast cancer cell lines. MCF-7 cells (a) or tamoxifen resistant MCF-7 cells (MCF-7 tam-R cells) (b) were measured by XTT assay after indicated hours of culturing in the presence of indicated compounds. All the results are representative of at least three independent experiments. (Error bars = mean ± S.E.M. Asterisks (*) mark samples significantly different from blank group with p < 0.05)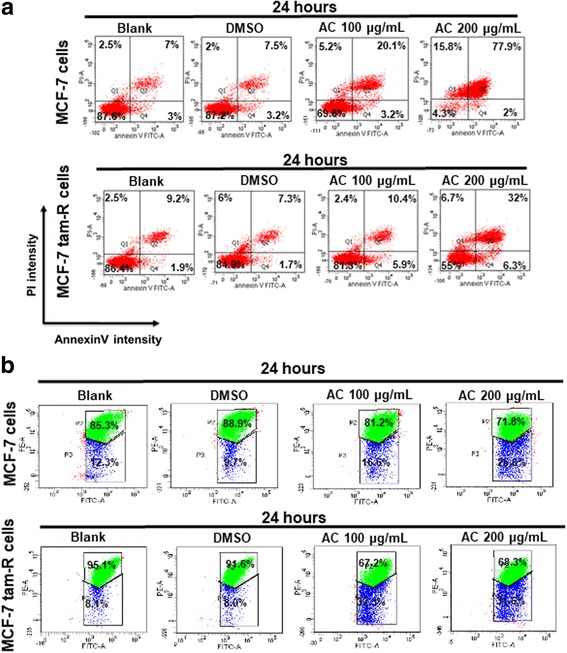
Fig. 3
AC induces apoptosis in breast…
Fig. 3
AC induces apoptosis in breast cancer cells. Breast cancer cells were treated without…
Fig. 3 AC induces apoptosis in breast cancer cells. Breast cancer cells were treated without or with indicated compounds for 24 h. Cell apoptosis was detected by flow cytometry with annexin-V-FITC/PI dual staining or mitochondrial membrane potential assay (mitoscreen JC-1 staining assay). a For annexin-V-FITC/PI dual staining, the representative histograms of flow cytometric analysis using double staining with annexin-V-FITC (FITC-A) and PI (PI-A). Q1 (annexin-V−/PI+) show necrosis cells; Q2 (annexin-V+/PI+) show the late apoptosis cells; Q3 (annexin-V−/PI−) show normal cells; Q4 (annexin-V+/PI−) show the early apoptosis cells. b For mitochondrial membrane potential assay (mitoscreen JC-1 staining assay), dot Plots revealing depolarization of mitochondria in treated HCT 116 cells. The percentage of events in the upper gate (P2) and lower gate (P3) represent population of treated breast cancer cells having normal and depolarized mitochondria respectively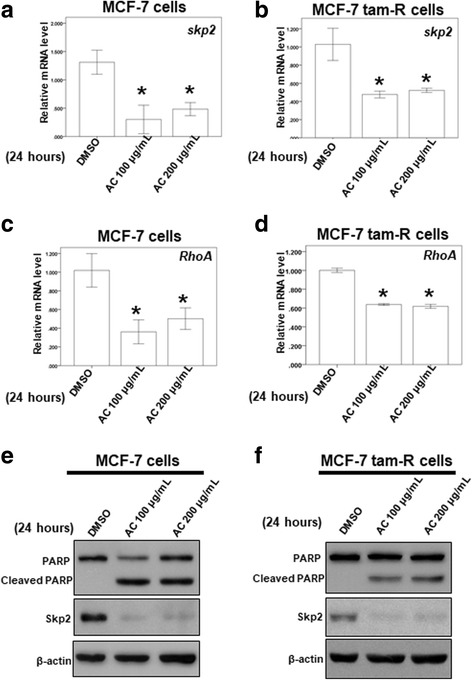
Fig. 4
The effect of AC on…
Fig. 4
The effect of AC on the mRNA expression of skp2 and RhoA and…
Fig. 4 The effect of AC on the mRNA expression of skp2 and RhoA and the protein expression of PARP and skp2. a-d Total mRNA was extracted from the two breast cancer cells after treat without or with indicated drugs for 24 h. The coding regions of human Skp2 and RhoA were used as probes for real time polymerase chain reaction analysis. e, f Total cell extracts of the two breast cancer cells were harvested from cells treated with DMSO or indicated concentrations of AC for 24 h. The protein was immunoblotted with polyclonal antibodies specific for PARP or Skp2. β-actin was used as an internal loading control. (Error bars = mean ± S.E.M. Asterisks (*) mark samples significantly different from DMSO group with p < 0.05)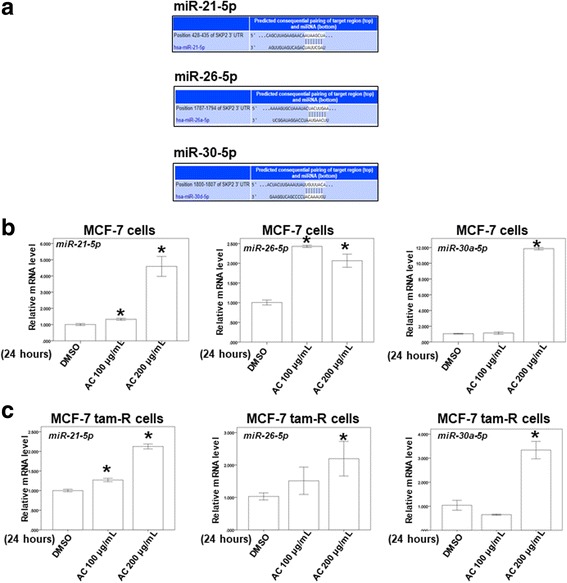
Fig. 5
The effect of AC on…
Fig. 5
The effect of AC on the microRNA expression of miR-21-5p, miR-26-5p and miR-30a-5p.…
Fig. 5 The effect of AC on the microRNA expression of miR-21-5p, miR-26-5p and miR-30a-5p. a miRNA target prediction of skp2. The conserved miR-21-5p, miR-26-5p and miR-30a-5p binding sites in skp2 3’-UTR region are detected by TargetScan analysis. b-c Total microRNA was extracted from the two breast cancer cells after treat without or with indicated drugs for 24 h. The coding regions of miR-21-5p, miR-26-5p and miR-30a-5p were used as probes for real time polymerase chain reaction analysis. (Error bars = mean ± S.E.M. Asterisks (*) mark samples significantly different from DMSO group with p < 0.05)