Antcin C from Antrodia cinnamomea Protects Liver Cells Against Free Radical-Induced Oxidative Stress and Apoptosis In Vitro and In Vivo through Nrf2-Dependent Mechanism
Figures
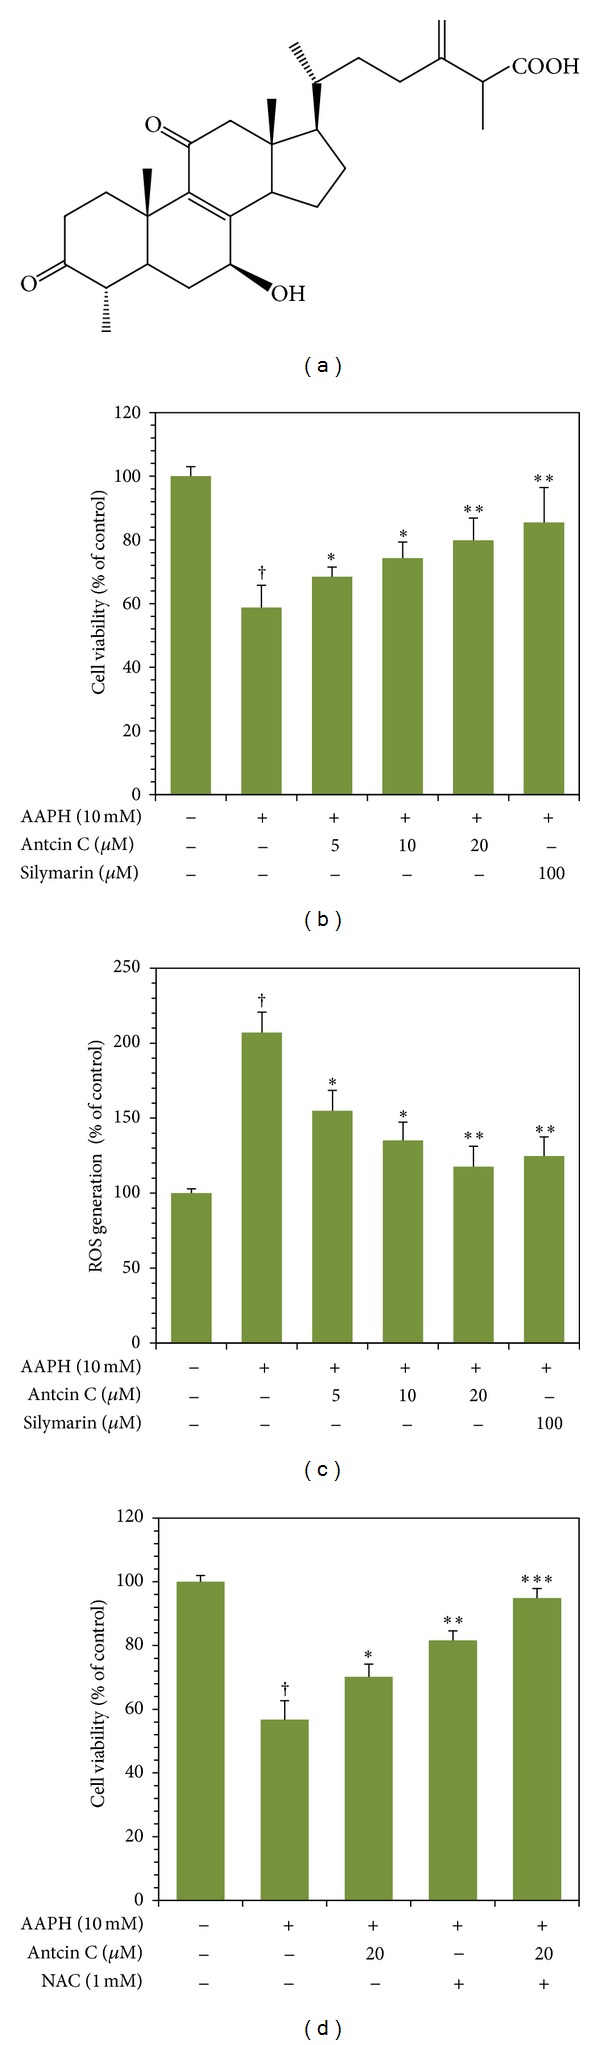
Figure 1
Protective effects of antcin C…
Figure 1
Protective effects of antcin C on AAPH-induced cell death and ROS generation in…
Figure 1 Protective effects of antcin C on AAPH-induced cell death and ROS generation in HepG2 cells. (a) Chemical structure of antcin C. (b) and (d) Cells were pretreated with increasing concentrations of antcin C (5–20 μM), silymarin (100 μM), or NAC (1 mM) for 2 h; then oxidative stress was induced by AAPH (10 mM) for 24 h. Cell viability was measured by MTT assay. Percentage of viable cells was calculated against that of control cells. (c) Cells were pretreated with antcin C (5–20 μM) or silymarin (100 μM) for 2 h, and then ROS generation was induced by AAPH (10 mM) for 30 min. The percentage of fluorescence intensity of the DCF stained cells was quantified using a fluorescence spectrophotometer as described in Materials and Methods. Values represent the mean ± SD of three independent experiments. *P < 0.05, **P < 0.01, and ***P < 0.001 were considered significant for sample versus AAPH. †P < 0.05 was considered significant for control versus AAPH.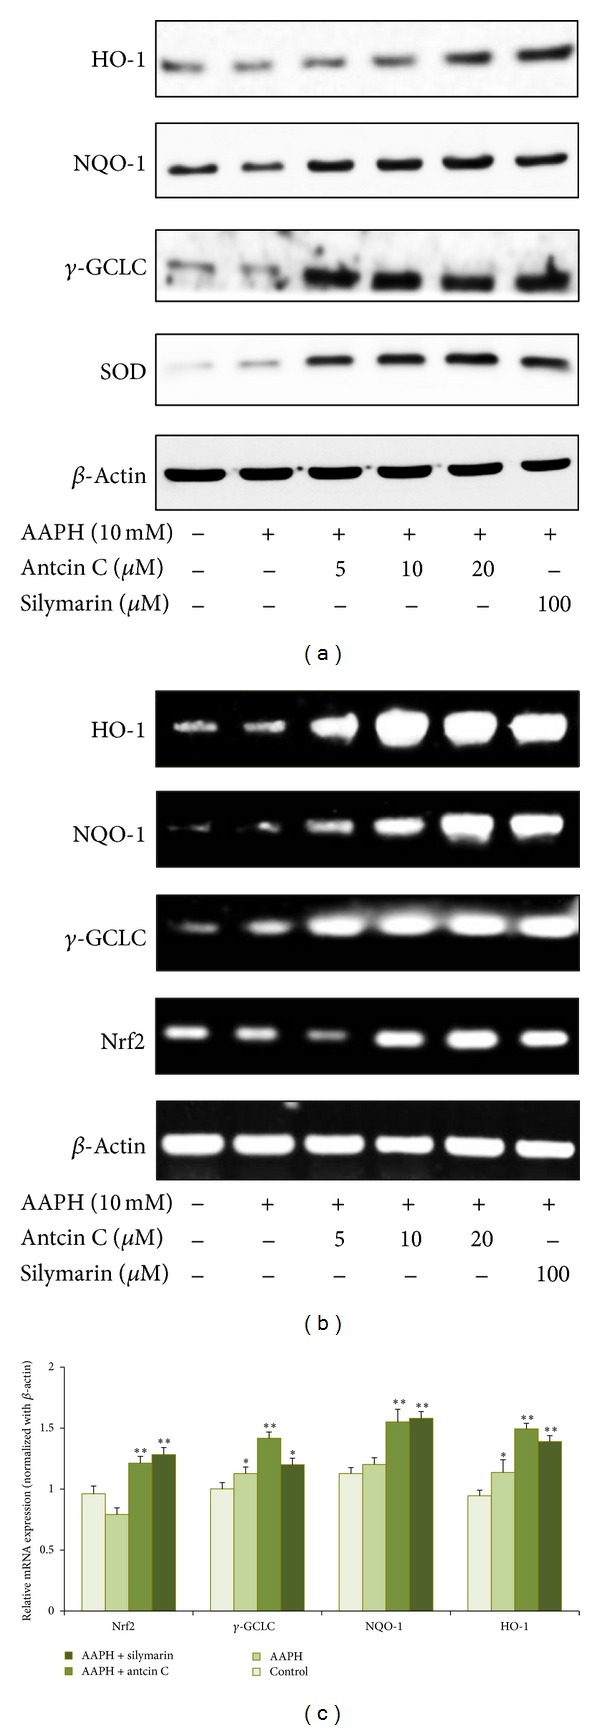
Figure 2
Antcin C induced antioxidant genes…
Figure 2
Antcin C induced antioxidant genes expression in AAPH-induced HepG2 cells. (a) HepG2 cells…
Figure 2 Antcin C induced antioxidant genes expression in AAPH-induced HepG2 cells. (a) HepG2 cells were preincubated with antcin C (5–20 μM) or silymarin (100 μM) for 2 h, and then exposed to AAPH (10 mM) for 24 h. Total cell lysates were prepared and subjected to western blot analysis to monitor the expression levels of antioxidant proteins, including HO-1, NQO-1, γ-GCLC, and SOD. β-actin served as an internal control. (b) The effect of antcin C on mRNA levels of antioxidant genes. HepG2 cells were pre-incubated with antcin C (5–20 μM) or silymarin (100 μM) for 2 h, and then exposed to AAPH (10 mM) for 6 h. The mRNA levels of HO-1, NQO-1, γ-GCLC were semiquantified by RT-PCR analyses. β-Actin was used as a loading control. (c) HepG2 cells were pre-incubated with antcin C (20 μM) or silymarin (100 μM) for 2 h, and then exposed to AAPH (10 mM) for 6 h. Q-PCR analysis was performed to monitor the expression levels of HO-1, NQO-1, γ-GCLC, and Nrf2 mRNA levels. Values represent the mean ± SD of three independent experiments. *P < 0.05, **P < 0.01, and ***P < 0.001 were considered significant for sample versus AAPH. †P < 0.05 was considered significant for control versus AAPH.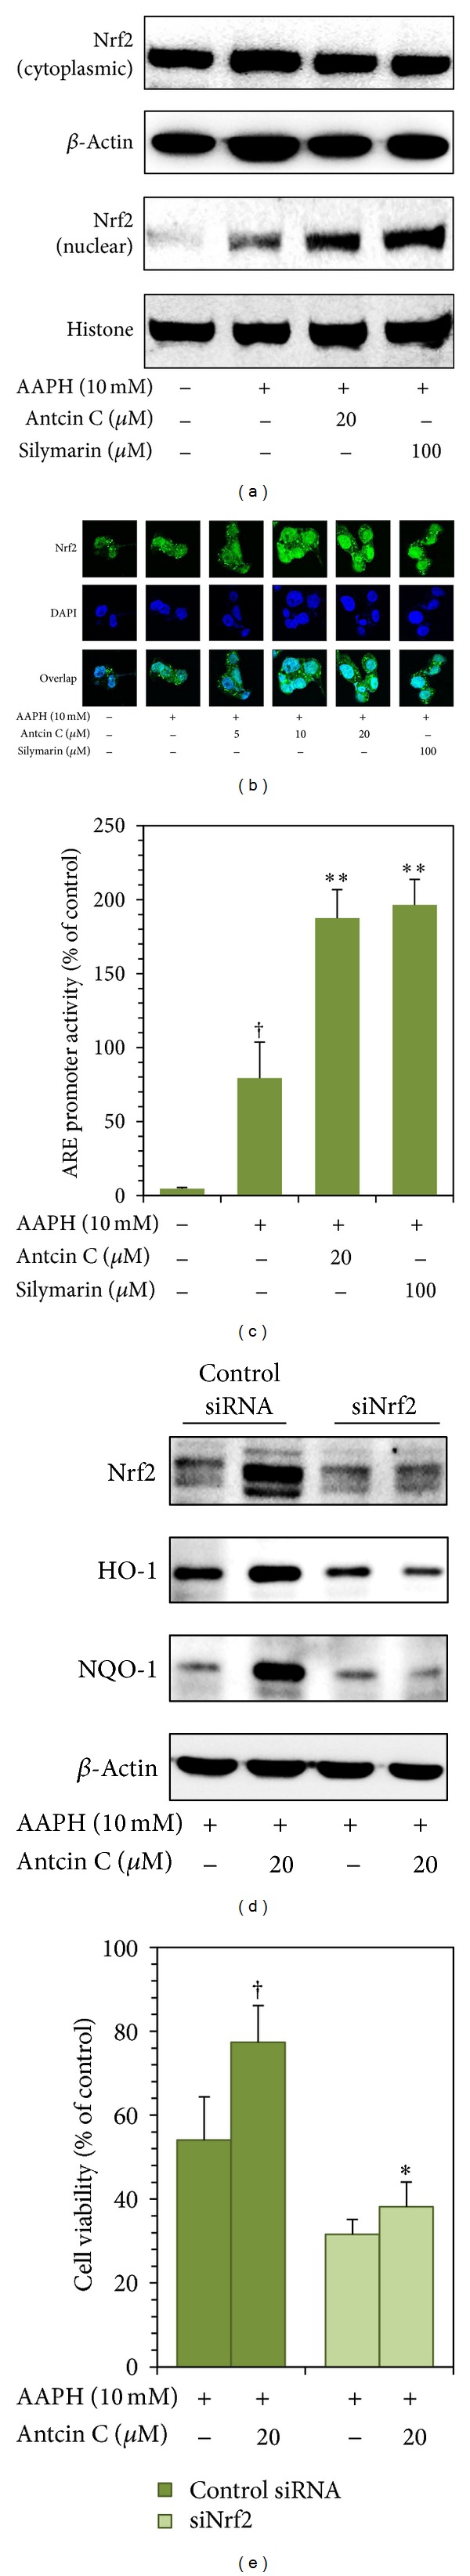
Figure 3
Antcin C promotes transcriptional activation…
Figure 3
Antcin C promotes transcriptional activation of Nrf2 in AAPH-induced HepG2 cells. (a) Cells…
Figure 3 Antcin C promotes transcriptional activation of Nrf2 in AAPH-induced HepG2 cells. (a) Cells were pretreated with antcin C (20 μM) or silymarin (100 μM) for 2 h, and then exposed to AAPH (10 mM) for 1 h. Nuclear and cytoplasmic lysates were prepared and subjected to western blot analysis. The accumulation of Nrf2 in the cytoplasm and the nucleus was monitored. (b) HepG2 cells were pretreated with antcin C (5–20 μM) or silymarin (100 μM) for 2 h, and then exposed to AAPH (10 mM) for 1 h. The protein expression levels of Nrf2 in AAPH-treated HepG2 cells were measured by immunofluorescence using Nrf2 specific primary and fluorescein isothiocyanate-conjugated secondary antibodies (green). The subcellular and nuclear distribution was photographed by fluorescence microscope. DAPI (1 μg/mL) was used to stain the nucleus. (c) HepG2 cells were transiently transfected with ARE plasmids by using lipofectamine and pre-incubated with antcin C (20 μM) or silymarin (100 μM) in the presence or absence of AAPH (10 mM) for 2 h. Cell lysates were mixed with luciferase reagents and quantified using an illuminometer. Relative ARE activity was calculated by dividing the relative luciferase unit (RLU) of treated cells by the RLU of untreated cells. Values represent the mean ± SD of three independent experiments. **P < 0.01 was considered significant for sample versus AAPH. †P < 0.05 was considered significant for control versus AAPH. (d) HepG2 cells were transfected with a specific siRNA against Nrf2 or a nonsilencing control. After 24 h of transfection, the cells were incubated with or without antcin C (20 μM for 2 h) and were induced by AAPH (10 mM) for 2–24 h. Protein expression levels of HO-1, NQO-1, and Nrf2 were monitored by western blot analysis. Cell viability was determined by MTT assay. Values represent the mean ± SD of three independent experiments. *P < 0.05 was considered significant for AAPH versus sample in the control siRNA. †P < 0.05 was considered significant for AAPH versus sample in the siNrf2 cells.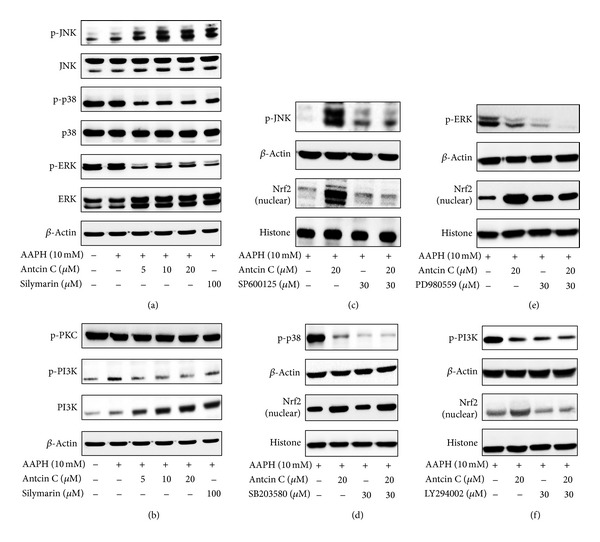
Figure 4
Effects of antcin C on…
Figure 4
Effects of antcin C on AAPH-induced MAPK activation in HepG2 cells. ((a)–(d)) Cells…
Figure 4 Effects of antcin C on AAPH-induced MAPK activation in HepG2 cells. ((a)–(d)) Cells were pretreated with antcin C (5–20 μM) or silymarin (100 μM) or MAPK inhibitors (30 μM) for 2 h, then exposed to AAPH (10 mM) for 15 min-1 h. Total cell lysates or the nuclear fraction were prepared and subjected to western blot analysis. Phosphorylated and nonphosphorylated forms of p38 MAPK, JNK1/2 and ERK1/2, PKC, and PI3K proteins were examined. β-actin was used as a loading control.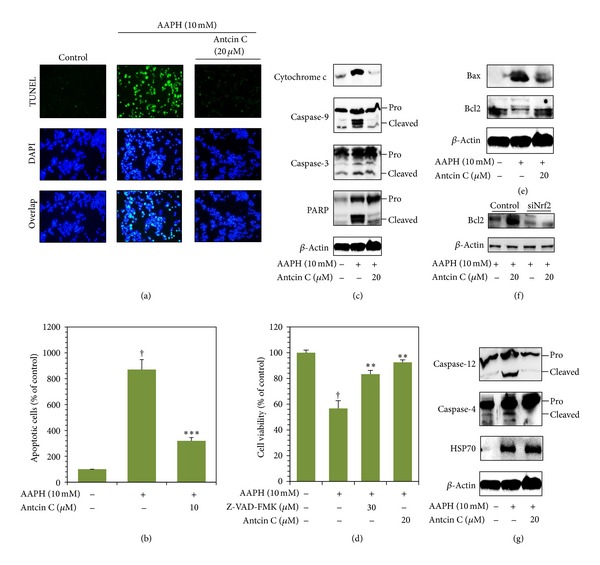
Figure 5
Antcin C protects HepG2 cells…
Figure 5
Antcin C protects HepG2 cells from AAPH-induced apoptosis. (a) The DNA fragmentation in…
Figure 5 Antcin C protects HepG2 cells from AAPH-induced apoptosis. (a) The DNA fragmentation in AAPH-induced HepG2 cells was determined by TUNEL assay as described in Materials and Methods. The average number of TUNEL-positive cells in microscopic fields (magnification ×200) from three separate samples. (b) Percentages of apoptotic cells were determined by the number of TUNEL positive cells compared to the control. Values represent the mean ± SD of three independent experiments. ***P < 0.001 was considered significant for AAPH versus sample. †P < 0.001 was considered significant for control versus AAPH. ((c), (e), (f)) HepG2 cells were pretreated with antcin C (20 μM) for 2 h, and then exposed to AAPH for 30 min. The effects of antcin C on AAPH-induced cytosolic cytochrome c, caspase 9, caspase 3, PARP, Bcl-2, and Bax (mitochondrial pathway) protein levels were examined by immunoblotting. (g) Caspase 4, caspase 12, and HSP70 (ER stress pathway) was examined using western blot analysis. (d) Cells were pretreated with antcin C with or without caspase-3 inhibitor Z-VAD-FMK (30 μM) for 2 h, and then cell death was induced by AAPH for 24 h. Cell viability was determined by MTT assay. Values represent the mean ± SD of three independent experiments. **P < 0.01 was considered significant for AAPH versus samples. †P < 0.01 was considered significant for control versus AAPH.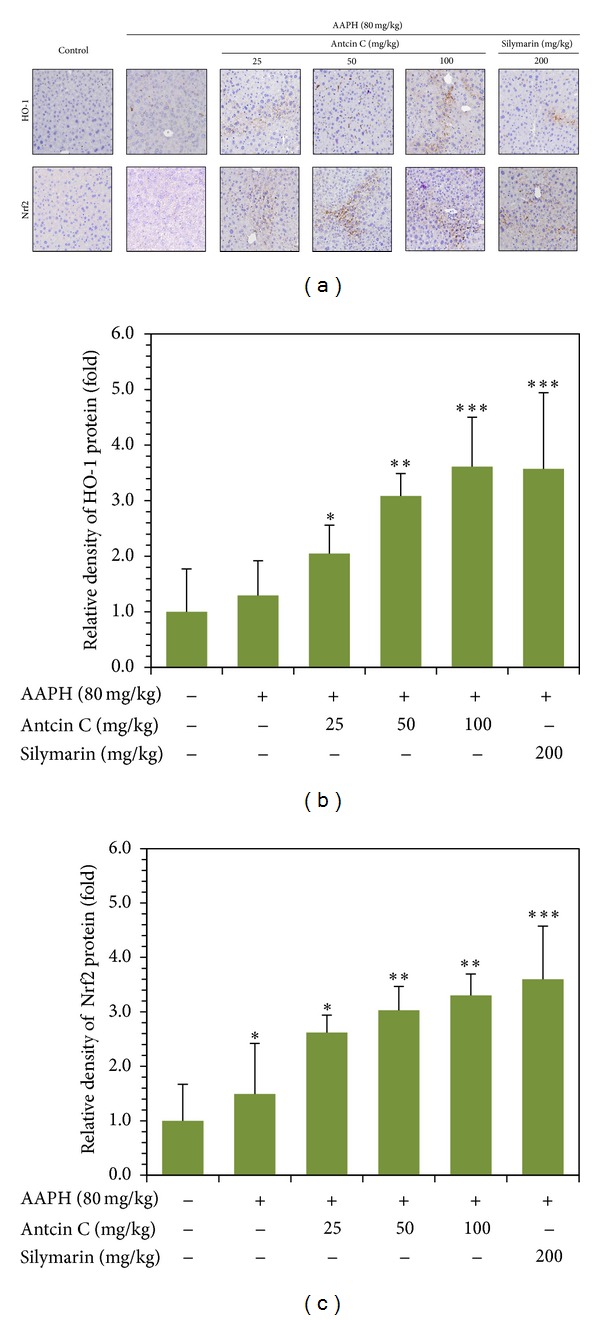
Figure 6
Antcin C upregulates antioxidant genes…
Figure 6
Antcin C upregulates antioxidant genes in AAPH-challenged liver tissues. Mice were pretreated with…
Figure 6 Antcin C upregulates antioxidant genes in AAPH-challenged liver tissues. Mice were pretreated with antcin C (25–200 mg/kg) or silymarin (100 mg/kg) for 5 days, and then challenged with a single dose of AAPH (80 mg/kg). Mice were sacrificed, and the liver sections were subjected to immunohistochemistry to analyse the protein expression levels of HO-1, NQO-1, and Nrf2 using specific antibodies. The relative intensity of antibody positive staining cells was quantified by Image-Pro Plus software. The results are presented as the mean ± SD of three independent experiments. *P < 0.05, **P < 0.01, and ***P < 0.001 were considered significant for sample versus control.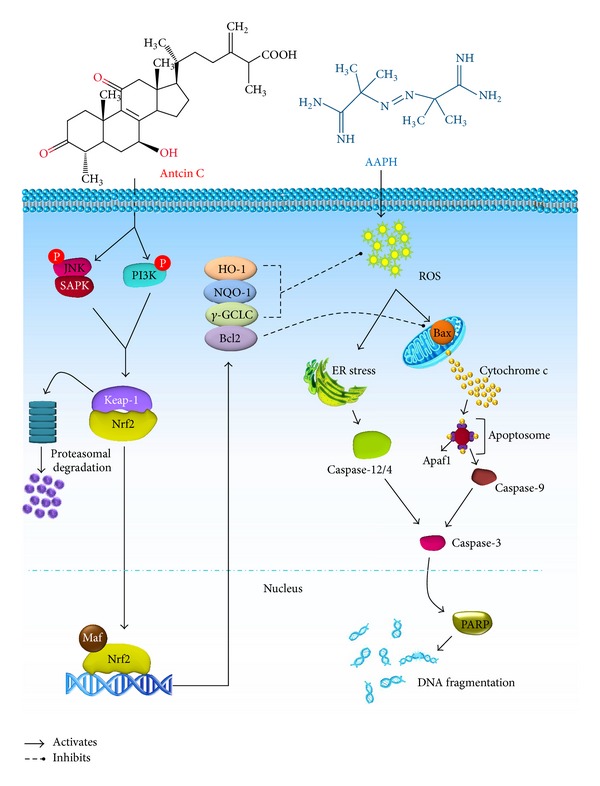
Figure 7
Schematic representation of antcin C-induced…
Figure 7
Schematic representation of antcin C-induced upregulation of antioxidative gene expression via the Nrf2/ARE…
Figure 7 Schematic representation of antcin C-induced upregulation of antioxidative gene expression via the Nrf2/ARE signaling pathway and suppression of AAPH-induced apoptosis in human hepatic HepG2 cells. All figures (7)