Uridine Diphosphate-Dependent Glycosyltransferases from Bacillus subtilis ATCC 6633 Catalyze the 15- O-Glycosylation of Ganoderic Acid A
Abstract
Bacillus subtilis ATCC (American type culture collection) 6633 was found to biotransform ganoderic acid A (GAA), which is a major lanostane triterpenoid from the medicinal fungus Ganoderma lucidum. Five glycosyltransferase family 1 (GT1) genes of this bacterium, including two uridine diphosphate-dependent glycosyltransferase (UGT) genes, BsUGT398 and BsUGT489, were cloned and overexpressed in Escherichia coli. Ultra-performance liquid chromatography confirmed the two purified UGT proteins biotransform ganoderic acid A into a metabolite, while the other three purified GT1 proteins cannot biotransform GAA. The optimal enzyme activities of BsUGT398 and BsUGT489 were at pH 8.0 with 10 mM of magnesium or calcium ion. In addition, no candidates showed biotransformation activity toward antcin K, which is a major ergostane triterpenoid from the fruiting bodies of Antrodia cinnamomea. One biotransformed metabolite from each BsUGT enzyme was then isolated with preparative high-performance liquid chromatography. The isolated metabolite from each BsUGT was identified as ganoderic acid A-15-O-β-glucoside by mass and nuclear magnetic resonance spectroscopy. The two BsUGTs in the present study are the first identified enzymes that catalyze the 15-O-glycosylation of triterpenoids.
Figures 
Figure 1
Biotransformation of ganoderic acid A…
Figure 1
Biotransformation of ganoderic acid A (GAA) by B. subtilis ATCC (American type culture…
Figure 1 Biotransformation of ganoderic acid A (GAA) by B. subtilis ATCC (American type culture collection) 6633. The strain was cultivated in modified glucose-nutrient (MGN) media containing 0.02 mg/mL of ganoderic acid A (GAA). The initial cultivation (dashed line) and the 72 h cultivation (solid line) of the fermentation broth were analyzed with ultra-performance liquid chromatography (UPLC). The UPLC operation conditions are described in the Materials and Methods section.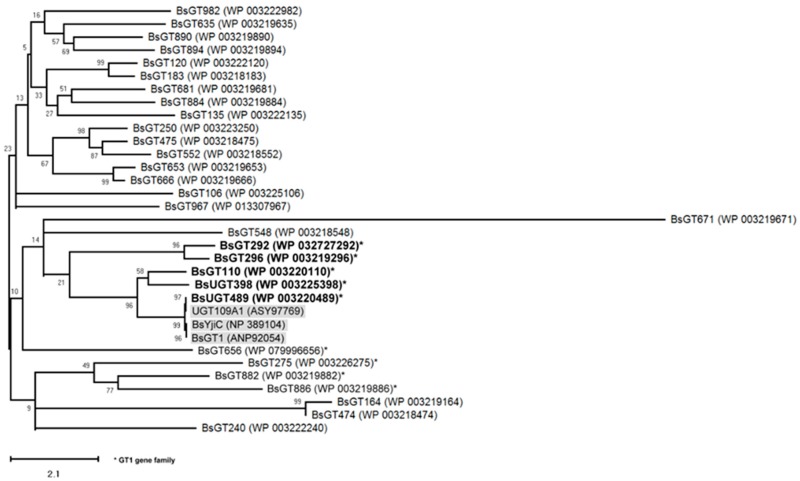
Figure 2
Molecular phylogenetic analysis of BsGT…
Figure 2
Molecular phylogenetic analysis of BsGT candidates inferred with the maximum likelihood (ML) method.…
Figure 2 Molecular phylogenetic analysis of BsGT candidates inferred with the maximum likelihood (ML) method. The best-fit ML model selection is mtREV24 [23]. The tree with the highest log likelihood (−6498.11) is shown. The percentage of trees in which the associated taxa clustered together is shown next to the branches. Initial tree(s) for the heuristic search were obtained automatically by applying the neighbor-join and BioNJ algorithms to a matrix of pairwise distances estimated using a JTT model and then selecting the topology with the superior log likelihood value. The tree is drawn to scale, with the branch lengths measured in the number of substitutions per site. The analysis involved 10 amino acid sequences. All positions with less than 95% site coverage were eliminated. That is, fewer than 5% alignment gaps, missing data, and ambiguous bases were allowed at any position. There were a total of 372 positions in the final dataset. Evolutionary analyses were conducted in MEGA X [24].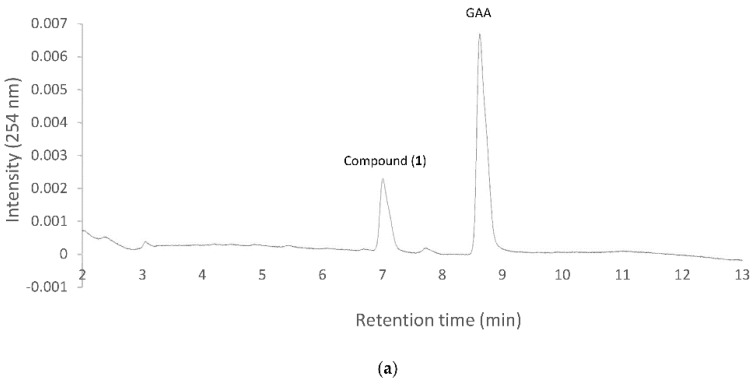
Figure 3
Biotransformation of GAA by purified…
Figure 3
Biotransformation of GAA by purified BsUGT398 ( a ) or BsUGT489 ( b…
Figure 3 Biotransformation of GAA by purified BsUGT398 (a) or BsUGT489 (b). Two micrograms of purified BsUGT398 or BsUGT489 were incubated with 0.4 mM uridine diphosphate (UDP)-glucose and 0.02 mg/mL of GAA in the presence of 50 mM Tris pH 8.0 and 10 mM of MgCl2. After 30 min incubation, the mixtures were analyzed with UPLC. The UPLC conditions are described in Materials and Methods.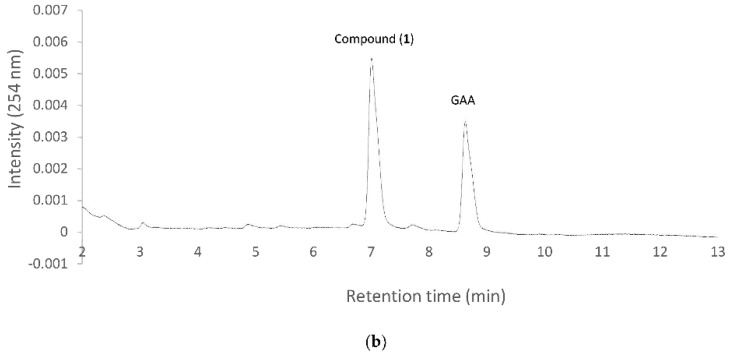
Figure 3
Biotransformation of GAA by purified…
Figure 3
Biotransformation of GAA by purified BsUGT398 ( a ) or BsUGT489 ( b…
Figure 3 Biotransformation of GAA by purified BsUGT398 (a) or BsUGT489 (b). Two micrograms of purified BsUGT398 or BsUGT489 were incubated with 0.4 mM uridine diphosphate (UDP)-glucose and 0.02 mg/mL of GAA in the presence of 50 mM Tris pH 8.0 and 10 mM of MgCl2. After 30 min incubation, the mixtures were analyzed with UPLC. The UPLC conditions are described in Materials and Methods.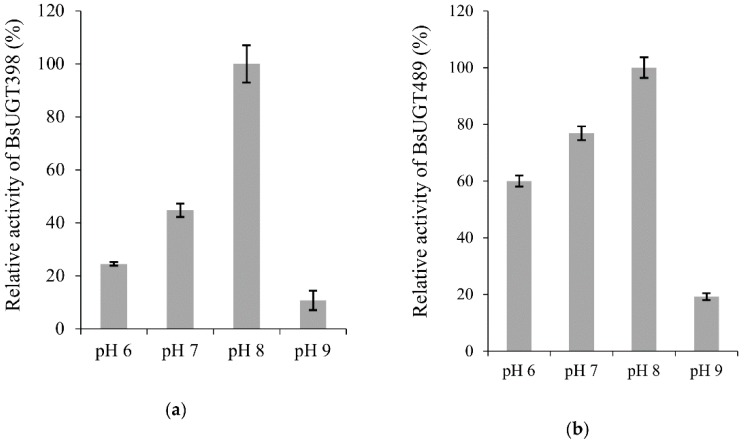
Figure 4
Effects of pH ( a…
Figure 4
Effects of pH ( a , b ), temperature ( c , d…
Figure 4 Effects of pH (a,b), temperature (c,d), and metal ion (e,f) on BsUGT398 (a,c,e) or BsUGT489 (b,d,f) activity. The standard condition was set as 2 µg of the purified enzyme, 1 mg/mL of GAA, 10 mM of MgCl2, and 10 mM of uridine diphosphate (UDP)-glucose in 50 mM of Tris at pH 8.0 and 40 °C. To determine the optimal reaction condition, the pH, temperature, or metal ion in the standard condition was replaced with the tested condition. Relative activity was obtained by dividing the area of the summation of the product peak of the reaction in the UPLC profile with that of the reaction at the standard condition. The mean (n = 3) is shown, and the standard deviations are represented by error bars.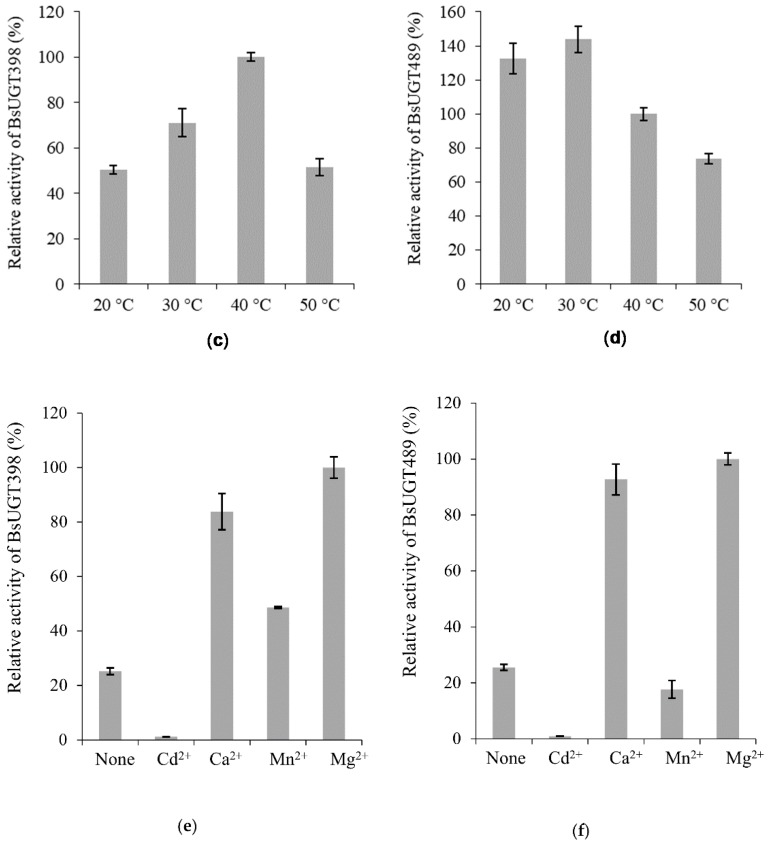
Figure 4
Effects of pH ( a…
Figure 4
Effects of pH ( a , b ), temperature ( c , d…
Figure 4 Effects of pH (a,b), temperature (c,d), and metal ion (e,f) on BsUGT398 (a,c,e) or BsUGT489 (b,d,f) activity. The standard condition was set as 2 µg of the purified enzyme, 1 mg/mL of GAA, 10 mM of MgCl2, and 10 mM of uridine diphosphate (UDP)-glucose in 50 mM of Tris at pH 8.0 and 40 °C. To determine the optimal reaction condition, the pH, temperature, or metal ion in the standard condition was replaced with the tested condition. Relative activity was obtained by dividing the area of the summation of the product peak of the reaction in the UPLC profile with that of the reaction at the standard condition. The mean (n = 3) is shown, and the standard deviations are represented by error bars.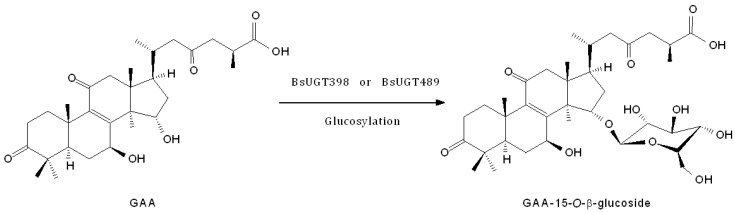
Figure 5
Biotransformation process of GAA by…
Figure 5
Biotransformation process of GAA by BsUGT398 or BsUGT489.
Figure 5 Biotransformation process of GAA by BsUGT398 or BsUGT489. All figures (7)