The adjuvant effects of high-molecule-weight polysaccharides purified from Antrodia cinnamomea on dendritic cell function and DNA vaccines
Figures
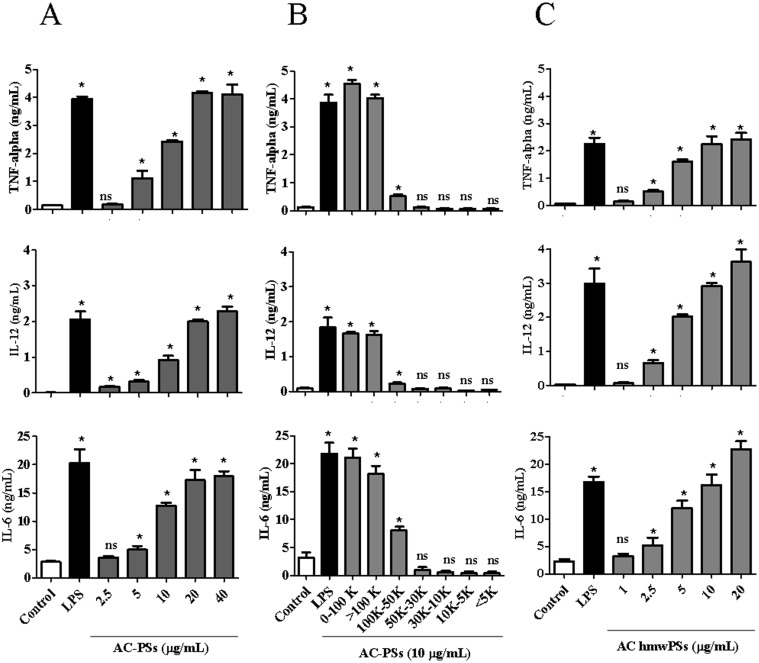
Fig 1. The hmwPSs were the major…
Fig 1. The hmwPSs were the major fraction of AC for DC activation.
DCs were…
Fig 1. The hmwPSs were the major fraction of AC for DC activation. DCs were treated with PBS (control), LPS (100 ng/mL), or various doses of AC PSs as indicated. Supernatants were collected after 24 h (6 h for TNF-α). The amounts of TNF-α, IL-6, and IL-12 were determined by ELISA. (A) The effect of crude AC PSs in the first water extraction. (B) The effect of each fraction of AC PSs with different molecular weights. (C) The effect of hmwPS fraction. The data shown are the mean + SD of three samples. NSp>0.05; *p<0.05 (Mann–Whitney U test) are comparisons between LPS- or AC PS-treated and PBS-treated DCs. All of the results are representative of three or four independent experiments.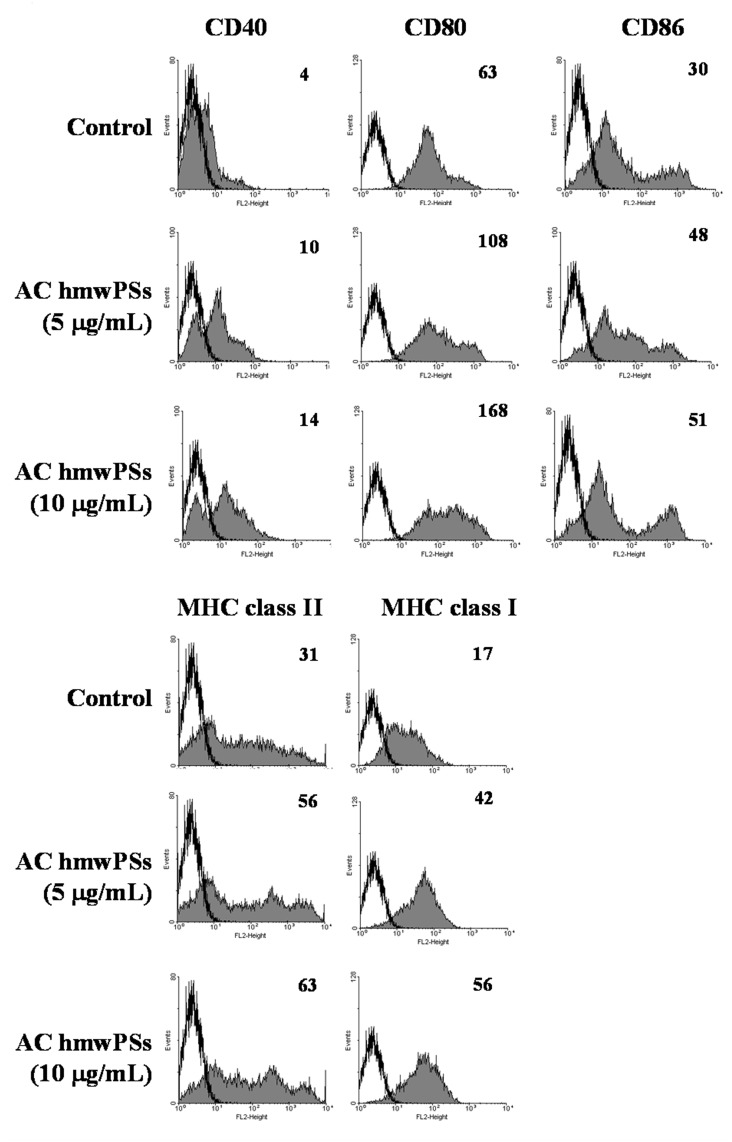
Fig 2. AC hmwPSs promoted DC maturation.
Fig 2. AC hmwPSs promoted DC maturation.
DCs were treated with PBS (control) or AC…
Fig 2. AC hmwPSs promoted DC maturation. DCs were treated with PBS (control) or AC hmwPSs (5 or 10 μg/mL) for 16 h. The expressions of MHC class I & II, CD40, CD80, and CD86 (gray-filled area) were determined by immunostaining and flow cytometry. All of the data shown were gated on CD11c+ cells. The black line represents staining with an isotype-matched control antibody. The level of expression is indicated as mean fluorescence intensity (MFI) in each graph. All of the results are representative of three or four independent experiments.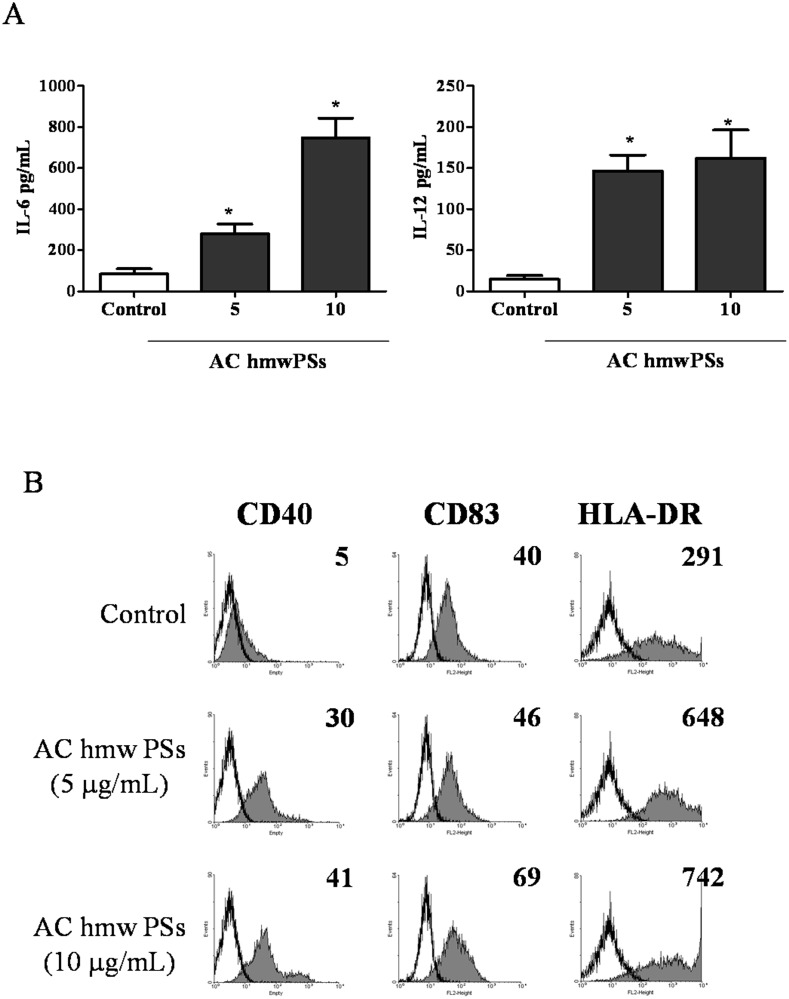
Fig 3. AC hmwPSs activated human MoDCs.
Fig 3. AC hmwPSs activated human MoDCs.
Human MoDCs were generated from PBMCs and treated…
Fig 3. AC hmwPSs activated human MoDCs. Human MoDCs were generated from PBMCs and treated with PBS (control) or AC hmwPSs (5 or 10 μg/mL). (A) After 24 h, supernatants were collected. The amounts of IL-6 and IL-12 were measured by ELISA. Data are presented as the mean + SD of three samples. *p<0.05 (Mann–Whitney U test) are comparisons between AC hmwPS-treated and PBS-treated MoDCs. (B) After 16 h, the expressions of CD40, CD83 and HLA-DR (gray-filled area) were determined by immunostaining and flow cytometry. All data shown were gated on CD1a+ cells. The black line represents staining with an isotype-matched control antibody. The level of expression is indicated as MFI in each graph. All data are representative of five independent experiments with cells from different donors.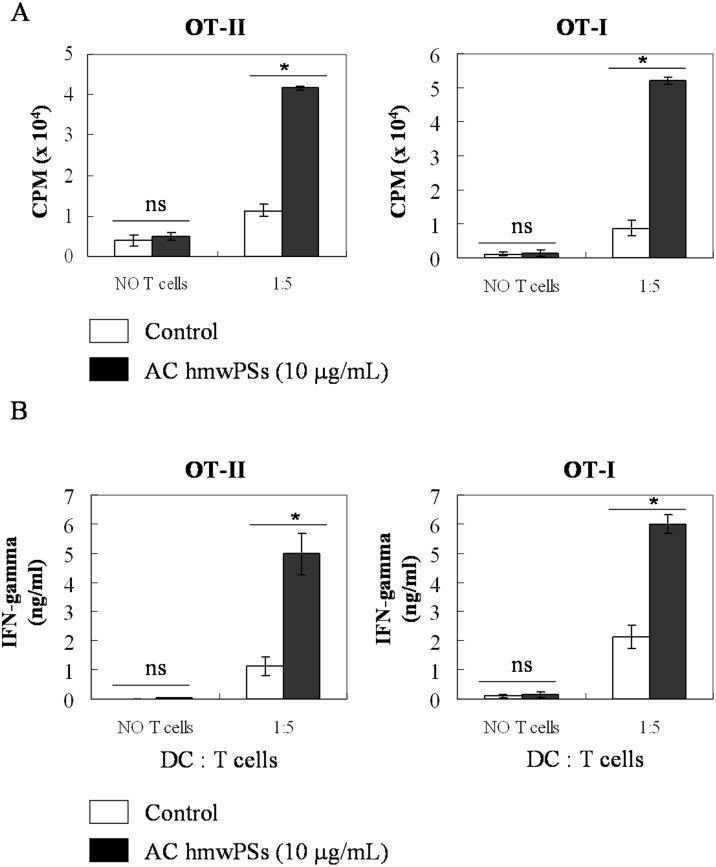
Fig 4. AC hmwPSs facilitated DC-induced T…
Fig 4. AC hmwPSs facilitated DC-induced T cell activation and Th1 differentiation.
OT-I or-II T…
Fig 4. AC hmwPSs facilitated DC-induced T cell activation and Th1 differentiation. OT-I or-II T cells were co-cultured with PBS- (white bar) or AC hmwPS-treated (10 μg/mL, black bar) DCs pulsed with OVA257–264 (for OT-I) or OVA323–339 (For OT-II) peptides at the indicated ratio of DC:T cell. (A) T cell proliferation was determined by 3H-thymidine incorporation after 3 days. (B) The supernatants were collected from the cultures after 4 days. IFN-γ production was measured by ELISA. The data are the mean + SD of three samples. NSp>0.05 (Mann–Whitney U test) are comparisons between AC hmwPS-treated and PBS-treated DCs. All of the results are representative of three independent experiments.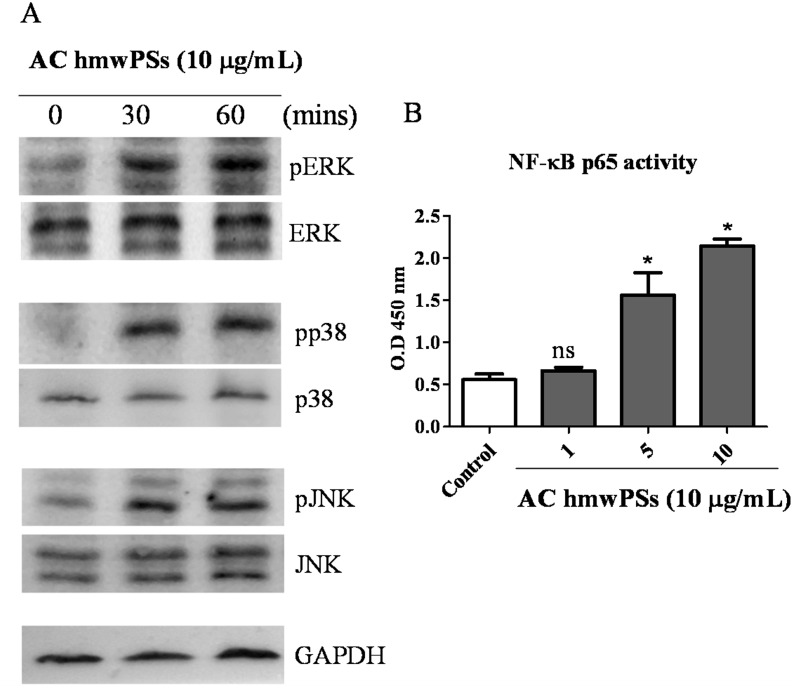
Fig 5. Activation of MAPKs and NF-κB…
Fig 5. Activation of MAPKs and NF-κB by AC hmwPSs in DCs.
DCs were collected…
Fig 5. Activation of MAPKs and NF-κB by AC hmwPSs in DCs. DCs were collected and treated with AC hmwPSs (10 μg/mL). Lysis buffer was added at the indicated time points to obtain whole cell lysates or nuclear extracts. (A) The activation of MAPKs was assayed by western blot. Whole cell lysates were incubated with antibodies against phosphorylated protein of ERK, JNK, and p38 MAPK, and then detected with specific 2nd antibodies and ECL system. The loading controls are shown and represent the use of antibodies against the total protein of these MAPKs. The data are representative of three independent experiments. (B) The activation of NF-κB was determined by p65 binding assay. The NF-κB binding activity in nuclear extract was measured using TransAM NF-κB p65 ELISA kit and shown as value read at OD450. The data are the mean + SD of three samples. NSp>0.05 (Mann–Whitney U test) are comparisons between LPS- or AC hmwPS-treated and PBS-treated DCs. All of the results are representative of three independent experiments.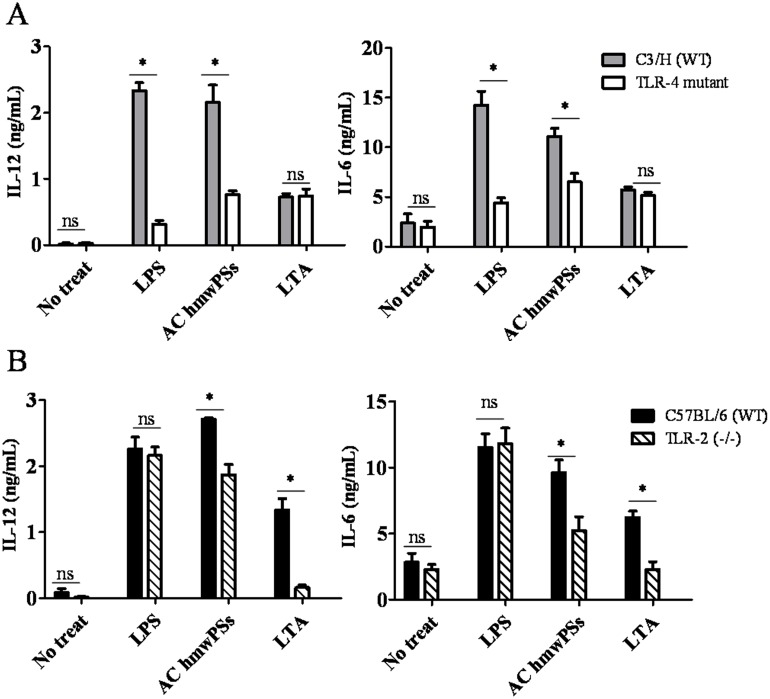
Fig 6. TLR2 and TLR4 were involved…
Fig 6. TLR2 and TLR4 were involved in DC activation by AC hmwPSs.
DCs were…
Fig 6. TLR2 and TLR4 were involved in DC activation by AC hmwPSs. DCs were generated from (A) C3H/HeN and C3H/HeJ (TLR4 mutant), or (B) C57BL/6 and TLR-2 KO mice, and then treated with PBS (control), LPS (100 ng/mL), LTA (1 μg/mL), or AC hmwPSs (10 μg/mL). The supernatants were collected after 24 h. The levels of IL-6 and IL-12 were determined by ELISA. The data shown are the mean + SD of three samples. NSp>0.05; *p<0.05 (Mann–Whitney U test) are comparisons between LPS-, LTA- or AC hmwPS-treated and PBS-treated DCs. All of the results are representative of three independent experiments.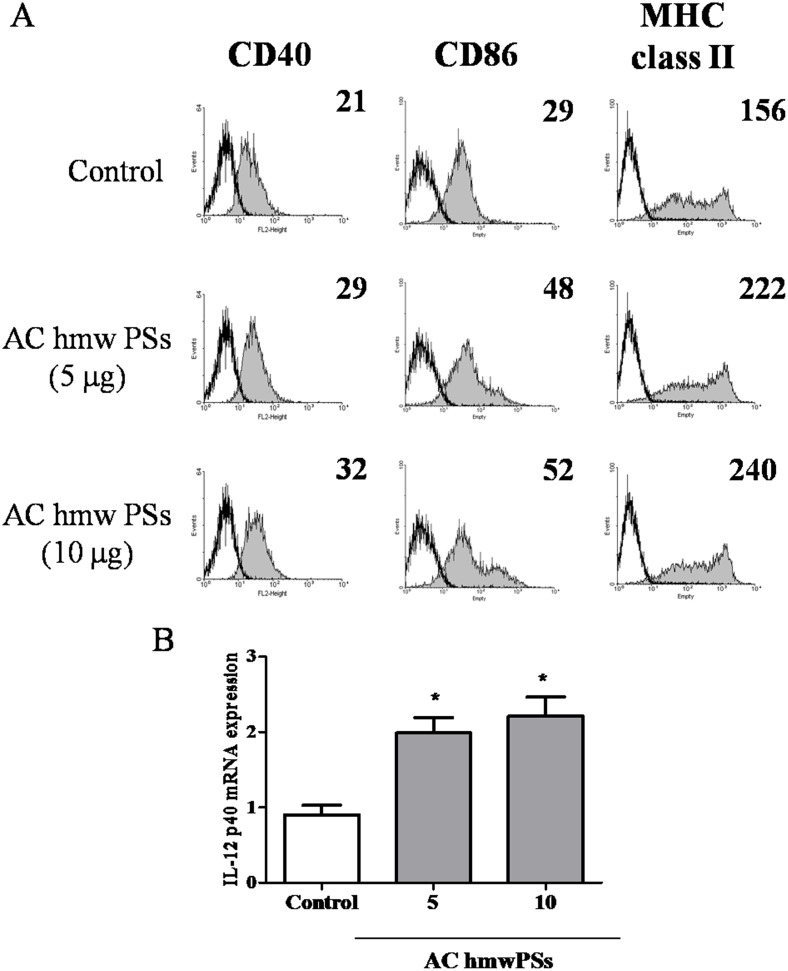
Fig 7. AC hmwPSs promoted DC activation…
Fig 7. AC hmwPSs promoted DC activation in vivo .
CD11c + DCs were isolated from…
Fig 7. AC hmwPSs promoted DC activation in vivo. CD11c+ DCs were isolated from draining lymph nodes and spleen of mice intraperitoneally injected with PBS (control) or AC hmwPSs (5 or 10 μg/mouse) after 6 h. (A) The expressions of CD40, CD86 and MHC class II (gray-filled area) were determined by immunostaining and flow cytometry. The black line represents staining with an isotype-matched control antibody. The level of expression is indicated as MFI in each graph. (B) The amount of IL-12 was determined by quantitative real-time PCR. *p<0.05 (Mann–Whitney U test) are comparisons between AC hmwPS-treated and PBS-treated mice. All of the results are representative of three or four independent experiments.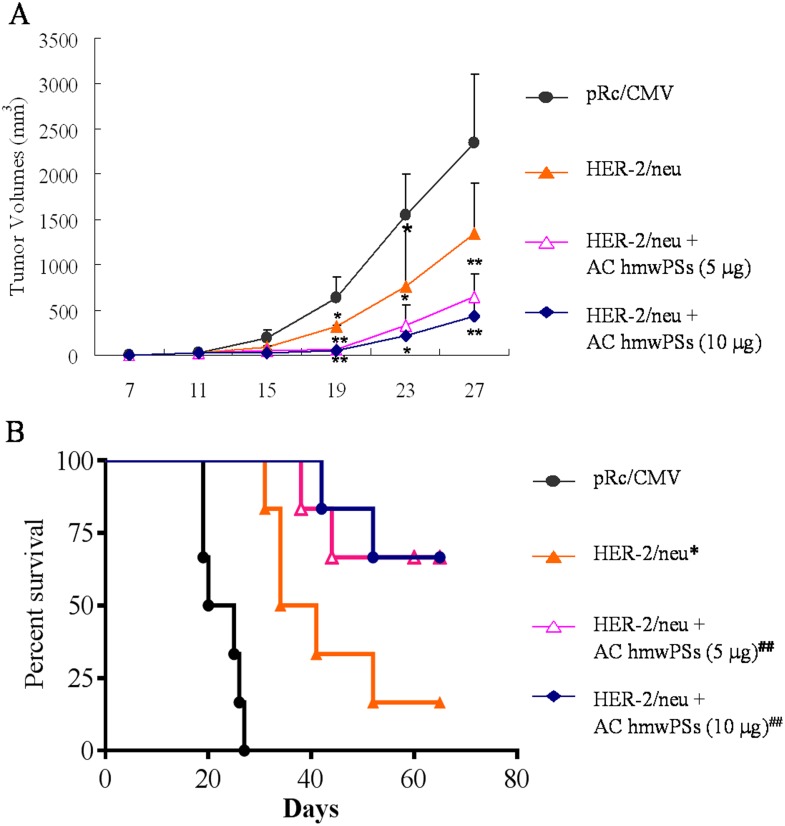
Fig 8. AC hmwPSs enhanced the therapeutic…
Fig 8. AC hmwPSs enhanced the therapeutic effect of HER-2/neu DNA vaccine in mouse tumor…
Fig 8. AC hmwPSs enhanced the therapeutic effect of HER-2/neu DNA vaccine in mouse tumor model. The p185neu-expressing MTB-2 cells were inoculated in mice as described in the Materials and Methods. After ten days, the tumor-bearing mice were treated with HER-2/neu DNA vaccine or vaccine combined with AC hmwPSs, as indicated. The data shown are the mean ± SD of six to seven mice per group. (A) Tumor growth curve in mice after vaccination. The tumor volumes were calculated as described in Materials and Methods section at the indicated day. *p<0.05, **p<0.01 (Mann–Whitney U test) are comparisons of treatment between all vaccinations and vector alone. (B) The Kaplan-Meier survival curve of mice (N = 5) after vaccination. *p<0.05 is comparisons of treatment between HER-2/neu DNA vaccine and vector alone. ##p<0.05 are comparisons of treatment between HER-2/neu DNA vaccine + AC hmwPSs and HER-2/neu DNA vaccine. All of the results are representative of three independent experiments.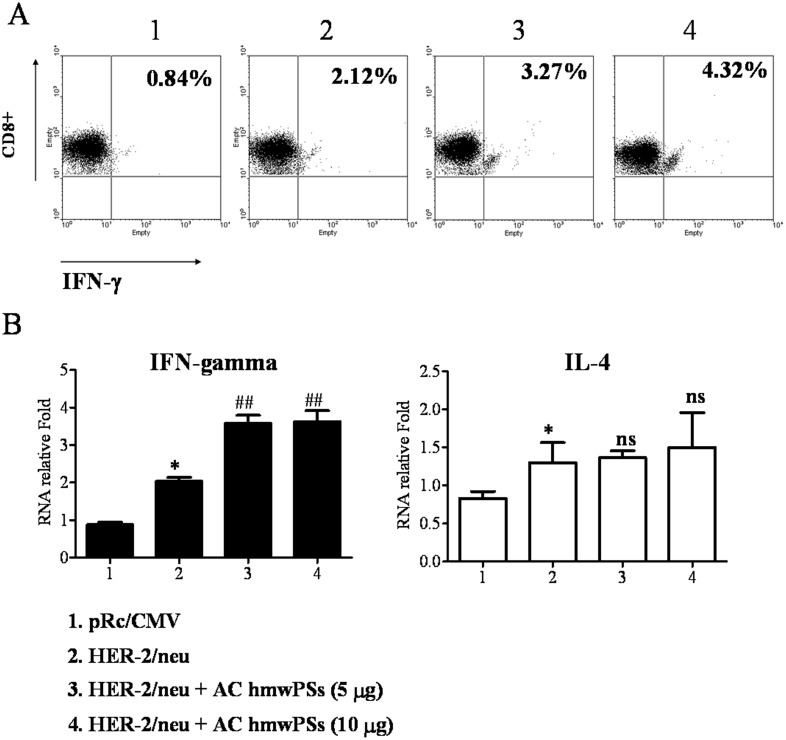
Fig 9. AC hmwPSs polarized the Th1…
Fig 9. AC hmwPSs polarized the Th1 responses induced by HER-2/neu DNA vaccination.
The tumor-bearing…
Fig 9. AC hmwPSs polarized the Th1 responses induced by HER-2/neu DNA vaccination. The tumor-bearing mice were treated with AC PSs, HER-2/neu DNA vaccine, or the combination as indicated for 6 days. Then, total inguinal LN cells were isolated from various vaccinated mice and incubated with recombinant HER-2/neu protein (10 μg/mL) for 16 h. (A) The production of IFN-γ by stimulated CD8+ T cells was detected by intracellular staining and flow cytometry. The percentage of CD8+IFN-γ+ cells in total CD8+ T cells is shown in each graph. (B) CD4+ T cells were purified from the total LN cells. The production of IFN-γ and IL-4 by stimulated CD4+ T cells were determined by quantitative real-time PCR. The data are normalized to HPRT expression in each sample and shown as the mean + SD of five mice. *p<0.05 (Mann–Whitney U test) are comparisons of treatment between HER-2/neu DNA vaccine and control. NSp>0.05; ##p<0.05 are comparisons of treatment between HER-2/neu DNA vaccine + AC hmwPSs and HER-2/neu DNA vaccine alone. All of the data are representative of three independent experiments. All figures (9)