Sexual Crossing, Chromosome-Level Genome Sequences, and Comparative Genomic Analyses for the Medicinal Mushroom Taiwanofungus Camphoratus (Syn. Antrodia Cinnamomea, Antrodia Camphorata)
Abstract
Taiwanofungus camphoratus mushrooms are a complementary and alternative medicine for hangovers, cancer, hypertension, obesity, diabetes, and inflammation. Though Taiwanofungus camphoratus has attracted considerable biotechnological and pharmacological attention, neither classical genetic nor genomic approaches have been properly established for it. We isolated four sexually competent monokaryons from two T. camphoratus dikaryons used for the commercial cultivation of orange-red (HC1) and milky-white (SN1) mushrooms, respectively. We also sequenced, annotated, and comparatively analyzed high-quality and chromosome-level genome sequences of these four monokaryons. These genomic resources represent a valuable basis for understanding the biology, evolution, and secondary metabolite biosynthesis of this economically important mushrooms. We demonstrate that T. camphoratus has a tetrapolar mating system and that HC1 and SN1 represent two intraspecies isolates displaying karyotypic variation. Compared with several edible mushroom model organisms, T. camphoratus underwent a significant contraction in the gene family and individual gene numbers, most notably for plant, fungal, and bacterial cell-wall-degrading enzymes, explaining why T. camphoratus mushrooms are rare in natural environments, are difficult and time-consuming to artificially cultivate, and are susceptible to fungal and bacterial infections. Our results lay the foundation for an in-depth T. camphoratus study, including precise genetic manipulation, improvements to mushroom fruiting, and synthetic biology applications for producing natural medicinal products. IMPORTANCETaiwanofungus camphoratus (Tc) is a basidiomycete fungus that causes brown heart rot of the aromatic tree Cinnamomum kanehirae. The Tc fruiting bodies have been used to treat hangovers, abdominal pain, diarrhea, hypertension, and other diseases first by aboriginal Taiwanese and later by people in many countries. To establish classical genetic and genomic approaches for this economically important medicinal mushroom, we first isolated and characterized four sexually competent monokaryons from two dikaryons wildly used for commercial production of Tc mushrooms. We applied PacBio single molecule, real-time sequencing technology to determine the near-completed genome sequences of four monokaryons. These telomere-to-telomere and gapless haploid genome sequences reveal all genomic variants needed to be studied and discovered, including centromeres, telomeres, retrotransposons, mating type loci, biosynthetic, and metabolic gene clusters. Substantial interspecies diversities are also discovered between Tc and several other mushroom model organisms, including Agrocybe aegerita, Coprinopsis cinerea, and Schizophyllum commune, and Ganoderma lucidum.
Figures 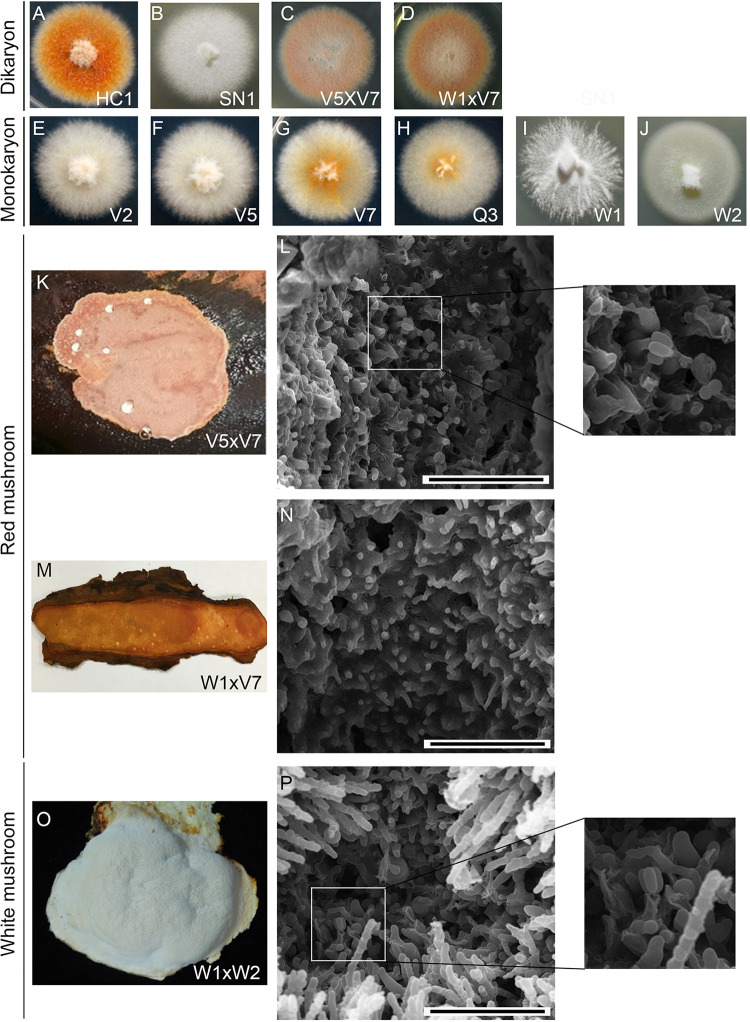
FIG 1
Morphological characterization of T. camphoratus…
FIG 1
Morphological characterization of T. camphoratus vegetative mycelia and fruiting bodies. (A to J)…
FIG 1 Morphological characterization of T. camphoratus vegetative mycelia and fruiting bodies. (A to J) Colony morphology and color of vegetative dikaryotic and monokaryotic cultures. (K to P) Cryo-scanning electron microscopy images of the surfaces of three representative T. camphoratus mushrooms. Only W1×W2 and V5×V7 (but not W1×V7) mushrooms show a few basidia with four basidiospores. The scale bar = 0.04 mm.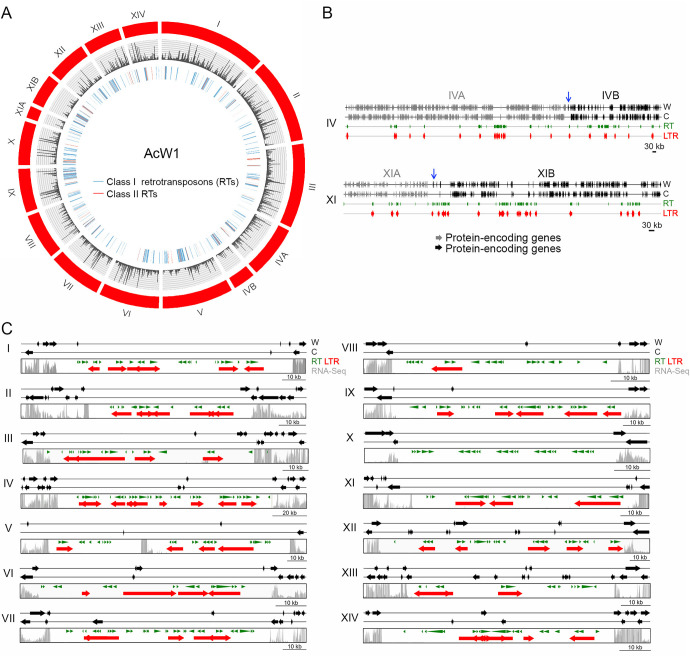
FIG 2
The 14 W1 chromosomes and…
FIG 2
The 14 W1 chromosomes and their centromeres. (A) Visualization of the 14 W1…
FIG 2 The 14 W1 chromosomes and their centromeres. (A) Visualization of the 14 W1 chromosomes by using CIRCOS (http://circos.ca). The outer circle indicates all chromosomes and superscaffolds of W1 (in red). The middle circle is a plot of RNA-seq read depth. Class I RTs (in blue) and class II RTs (in red) are shown in the inner traces. (B) Schematic illustrating the overlapping regions between ChIVA (in gray) and ChIVB (in black), as well as between ChXIA (in gray) and ChXIB (in black), respectively. The overlapping regions are indicated by blue arrows. (C) Schematic illustrating the 14 putative W1 centromeric regions. These intervals were defined as the longest ORF-free regions on the respective chromosomes and mostly contain RTs. RNA sequencing analysis revealed that the identified centromeric regions also presented reduced levels of transcriptional activity relative to flanking non-centromeric regions. The gray bars indicate RNA-seq read depth. RTs predicted by the RepeatMasker search program (http://www.repeatmasker.org/) (8) and the LTR-finder program (http://tlife.fudan.edu.cn/tlife/ltr_finder/) (12) are indicated in green and red, respectively. The locations of all 14 W1 centromeres are listed in Table S8.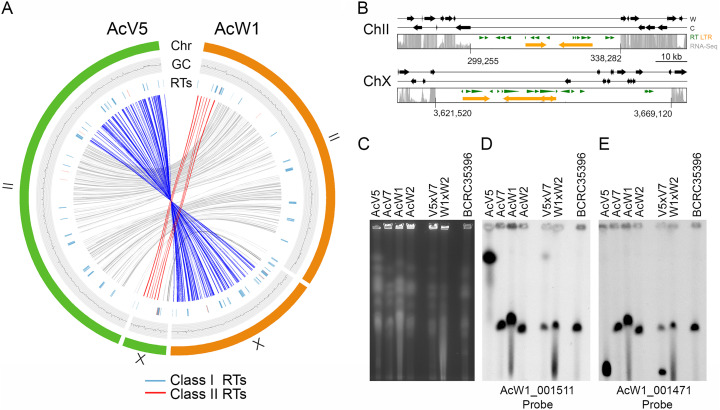
FIG 3
Chromosomal translocations in V5. (A)…
FIG 3
Chromosomal translocations in V5. (A) Collinearity relationships are depicted in red, blue, or…
FIG 3 Chromosomal translocations in V5. (A) Collinearity relationships are depicted in red, blue, or gray in the inner circle, respectively. The outer circles represent W1-ChII and W1-ChX (in orange), as well as V5-ChII and V5-ChX (in green). The GC contents (window size 5,000 bp) of the two chromosomes are shown in the middle traces. Class I RTs (in blue) and class II RT (in red) are shown in the inner traces. (B) Schematic illustrating the putative centromeric regions on V5-ChII and V5-ChX. The gray bars indicate RNA-seq read depth. RTs predicted by the RepeatMasker search program (http://www.repeatmasker.org/) (8) and the LTR-finder program (http://tlife.fudan.edu.cn/tlife/ltr_finder/) (12) are indicated in green and orange, respectively. The locations of two V5 centromeres are indicated. (C) PFGE was applied to separate the chromosomes of V5, V7, W1, W2, V5×V7, W1×W2, and BCRC35396. (D to E) Southern hybridization with two DNA probes, as indicated. These results provide additional evidence of our high-quality genome assembly for W1 and V5.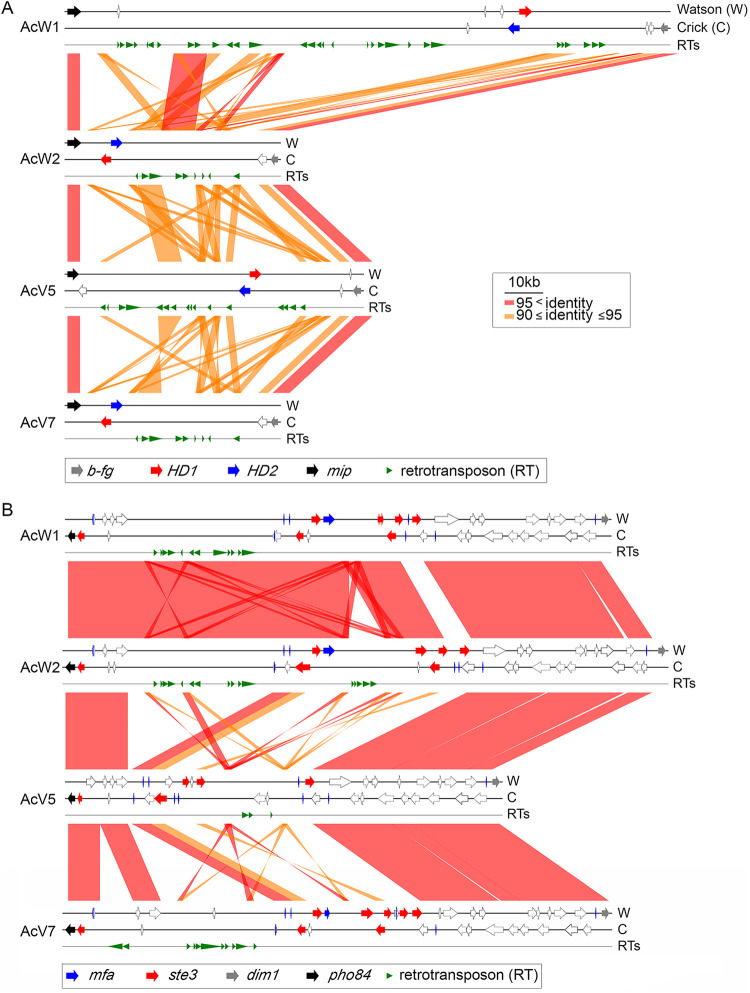
FIG 4
Synteny around the matA mating…
FIG 4
Synteny around the matA mating type loci (A) and matB mating type loci…
FIG 4 Synteny around the matA mating type loci (A) and matB mating type loci (B) of W1, W2, V5, and V7. The two DNA strands and retrotransposons are indicated as Watson (W), Crick (C), and RTs, respectively. RTs were predicted by the RepeatMasker search program (http://www.repeatmasker.org/) (8). HD1, HD2, b-fg, mip1, ste3, mfa, dim1, and pho84 are indicated by red, blue, gray, black, red, blue, gray, and black arrows, respectively. Other protein-encoding genes are indicated by open arrows.
FIG 5
Comparative transcriptomic identification of candidate…
FIG 5
Comparative transcriptomic identification of candidate T. camphoratus fruiting-related genes (FRGs) and differentially expressed…
FIG 5 Comparative transcriptomic identification of candidate T. camphoratus fruiting-related genes (FRGs) and differentially expressed genes (DEGs) in the orange-red T. camphoratus strains. (A, B) VENN diagram reveals that 8,289 T. camphoratus W1 protein-encoding genes have at least one ortholog in C. cinerea. Of those protein-encoding genes, 254 and 3,797 are highly similar in amino acid sequence to 410 C. cinerea FB-initiation genes (CcFBIGs) and 5,031 C. cinerea FB development genes (CcFBDGs) (20), respectively. (C) VENN diagram of 1,280 FRGs of T. camphoratus W1, of which 73 and 560 are orthologs of 58 CcFBIGs and 489 CcFBDGs, respectively, and a further 354 are T. camphoratus specific. Moreover, 289 are neither orthologs of CcFBIGs nor of CcFBDGs. (D) Pie chart of 3,835 lncRNAs in T. camphoratus W1. There are 188 fruiting-related lncRNAs (FRLRs) and 278 vegetative hyphae-related lncRNAs (VHLRs).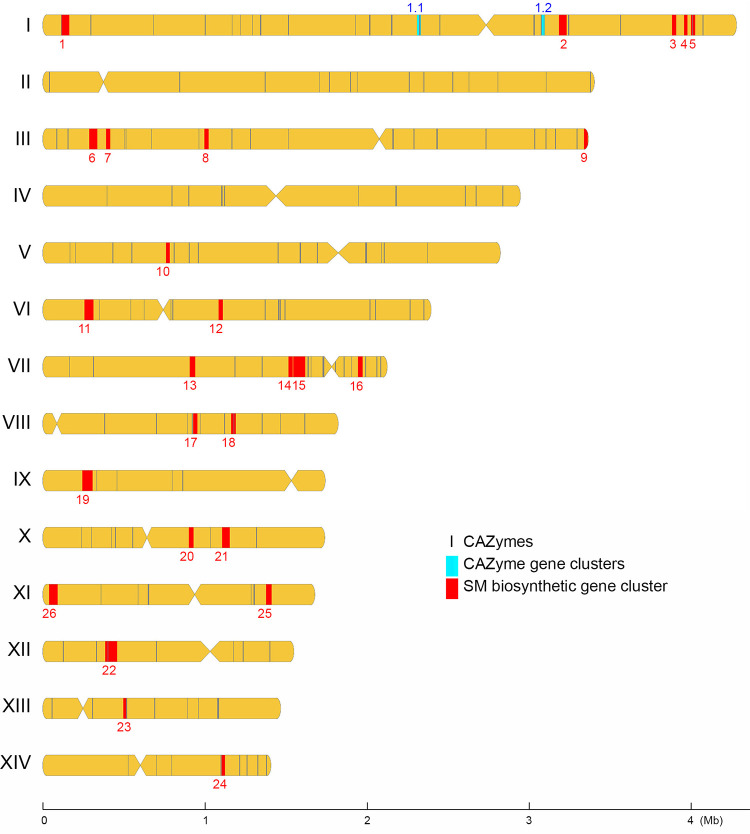
FIG 6
Chromosomal distribution of CAZyme genes,…
FIG 6
Chromosomal distribution of CAZyme genes, CAZ-GCs, and SM-BGCs in T. camphoratus W1. Centromere…
FIG 6 Chromosomal distribution of CAZyme genes, CAZ-GCs, and SM-BGCs in T. camphoratus W1. Centromere locations are shown by restricted width. All CAZyme genes were chosen along the sequence to be used as location markers. The locations of individual CAZyme genes, 2 CAZyme gene clusters (CAZ-GCs), and 26 secondary metabolite biosynthetic gene clusters (SM-BGCs) are indicated in black, cyan, and red, respectively.