Ergosterol Isolated from Antrodia camphorata Suppresses LPS-Induced Neuroinflammatory Responses in Microglia Cells and ICR Mice
Abstract
Inflammation caused by microglial activation is important in neurodegenerative diseases. In this research, we tried to identify safe and effective anti-neuroinflammatory agents by screening a natural compounds library and found that Ergosterol can inhibit the nuclear factor kappa-light-chain enhancer of the activated B cells (NF-κB) pathway induced by lipopolysaccharide (LPS) in microglia cells. Ergosterol has been reported to be an effective anti-inflammatory agent. Nevertheless, the potential regulatory role of Ergosterol in neuroinflammatory responses has not been fully investigated. We further investigated the mechanism of Ergosterol that regulates LPS-induced microglial activation and neuroinflammatory reactions both in vitro and in vivo. The results showed that Ergosterol can significantly decrease the pro-inflammatory cytokines induced by LPS in BV2 and HMC3 microglial cells, possibly by inhibiting the NF-κB, protein kinase B (AKT), and mitogen-activated protein kinase (MAPK) signaling pathways. In addition, we treated Institute of Cancer Research (ICR) mice with a safe concentration of Ergosterol following LPS injection. Ergosterol treatment significantly decreased microglial activation-associated ionized calcium-binding adapter molecule-1 (IBA-1), NF-κB phosphorylation, and pro-inflammatory cytokine levels. Moreover, Ergosterol pretreatment clearly reduced LPS-induced neuron damage by restoring the expression of synaptic proteins. Our data may provide insight into possible therapeutic strategies for neuroinflammatory disorders.
Figures 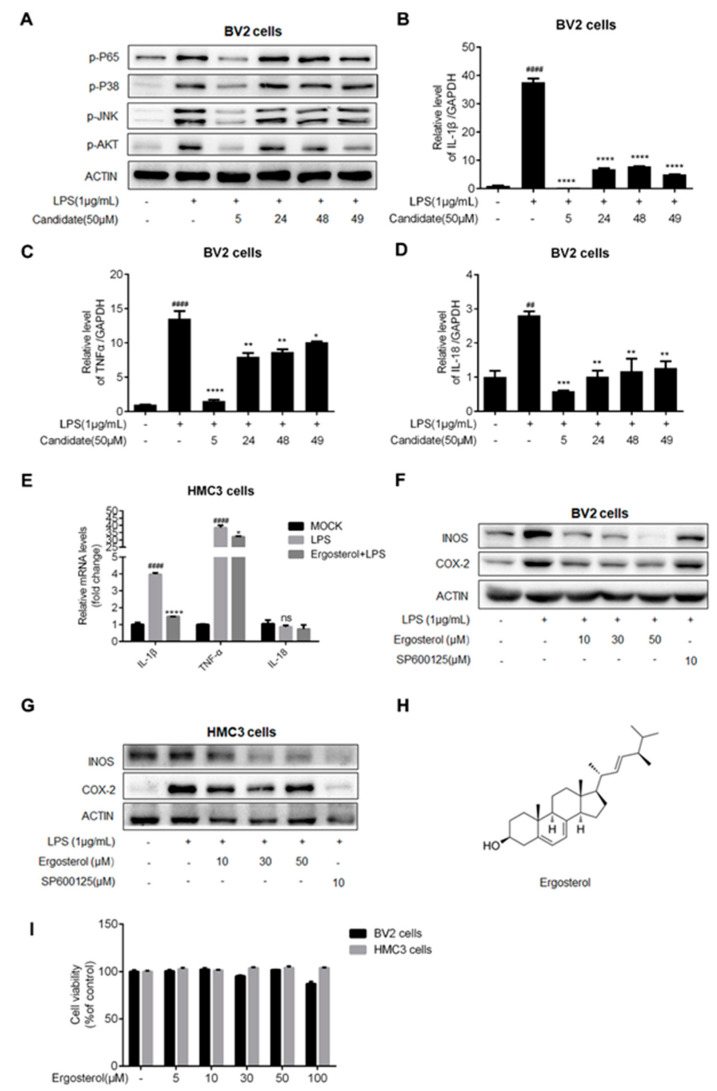
Figure 1
Ergosterol inhibits the microglial inflammation…
Figure 1
Ergosterol inhibits the microglial inflammation induced by LPS treatment. ( A ) BV2…
Figure 1 Ergosterol inhibits the microglial inflammation induced by LPS treatment. (A) BV2 cells pretreated with a natural compound for 2.5 h, and then LPS added at a final concentration of 1 μg/mL. After 30 min, the protein levels of p-P65, p-P38, p-JNK, and p-AKT were detected using Western blot. (B–D) BV2 cells were incubated with Ergosterol for 2.5 h, and then, LPS was added. After 6 h, the mRNA levels of IL-1β, TNF-α, and IL-18 were detected by qRT-PCR. (E) The same experimental procedure was performed in the HMC3 cells to detect the mRNA levels of IL-1β, TNF-α, and IL-18 by qRT-PCR. (F,G) BV2 and HMC3 cells pretreated with Ergosterol or SP600125 for 2.5 h, followed by LPS stimulation for 22 h; Western blot was used to determine the protein levels of INOS and COX-2. (H) Chemical name and structure of Ergosterol. (I) BV2 and HMC3 cells were seeded on 96-well plates and then treated with Ergosterol (0, 5, 10, 30, 50, 100 μM) for 24 h. Cell viability was assessed using a Cell Counting Kit-8 (CCK8) assay. All data are mean ± SEM of triplicate values. Statistical significance was analyzed using one-way ANOVA and t test. # Significantly different from the control; * significantly different from the LPS-treated group. Significance: ## p < 0.01, #### p < 0.0001, * p < 0.05, ** p < 0.01, *** p < 0.001, **** p < 0.0001.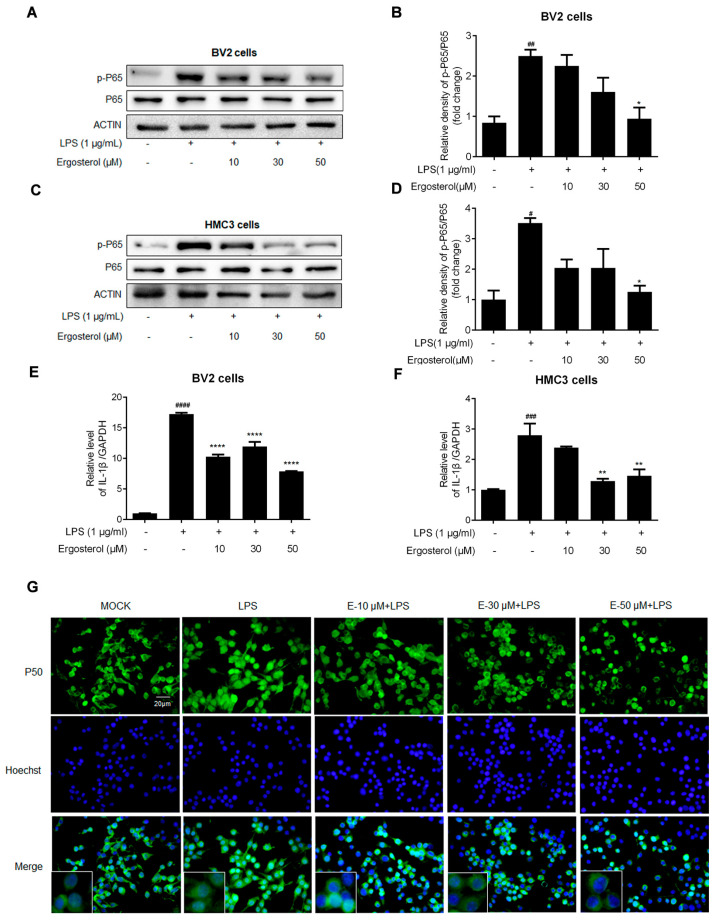
Figure 2
Ergosterol suppresses activation of the…
Figure 2
Ergosterol suppresses activation of the NF-κB signaling pathway in BV2 and HMC3 cells…
Figure 2 Ergosterol suppresses activation of the NF-κB signaling pathway in BV2 and HMC3 cells stimulated by LPS. BV2 and HMC3 cells pretreated with Ergosterol for 2.5 h, then LPS stimulated (1 μg/mL) for 30 min; the cells were collected and lysed for protein detection, or the cell RNA was purified for qRT-PCR determining. (A–D) The protein levels of P65 and p-P65 in cell lysates were detected by Western blot. Actin was used as a housekeeping control. (E,F) The mRNA levels of IL-1β were detected with qRT-PCR. (G) Detection of the expression and localization of NF-κB P50 (P50) in BV2 cells by immunostaining with an anti-P50 antibody (green) and Hoechst for nucleus staining (blue). The image was observed and recorded with a fluorescence microscope; scale bar is 20 μm. All data are mean ± SEM of triplicate values. Statistical significance was analyzed using one-way ANOVA and t test. # Significantly different from the control; * significantly different from the LPS-treated group. Significance: # p < 0.05, ## p < 0.01, ### p < 0.01, #### p < 0.0001, * p < 0.05, ** p < 0.01, **** p < 0.0001.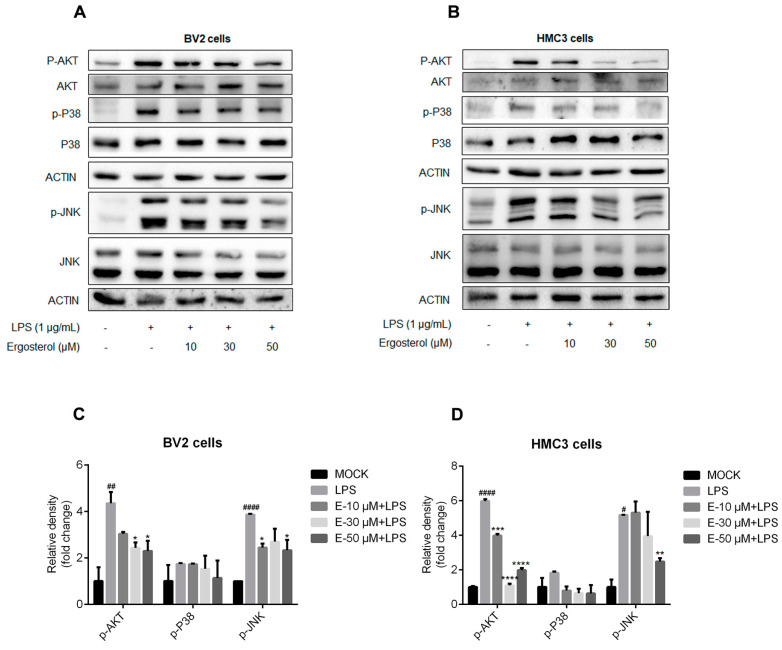
Figure 3
Ergosterol suppresses the activation of…
Figure 3
Ergosterol suppresses the activation of the MAPK and AKT signaling pathways in BV2…
Figure 3 Ergosterol suppresses the activation of the MAPK and AKT signaling pathways in BV2 and HMC3 cells stimulated by LPS. (A,C) BV2 microglial cells were pretreated for 2.5 h at the indicated concentration of Ergosterol and then stimulated by LPS (1 μg/mL) for 30 min. The protein levels of P38, p-P38, JNK, p-JNK, AKT, and p-AKT were determined by Western blot in the BV2 cells. Actin was used as a housekeeping control. (B,D) Similar experiments were performed with the HMC3 cells. All data are mean ± SEM of triplicate values. Statistical significance was analyzed using one-way ANOVA and t test. # Significantly different from the control; * significantly different from the LPS-treated group. Significance: # p < 0.05, ## p < 0.01, #### p < 0.0001, * p < 0.05, ** p < 0.01, *** p < 0.001, **** p < 0.0001.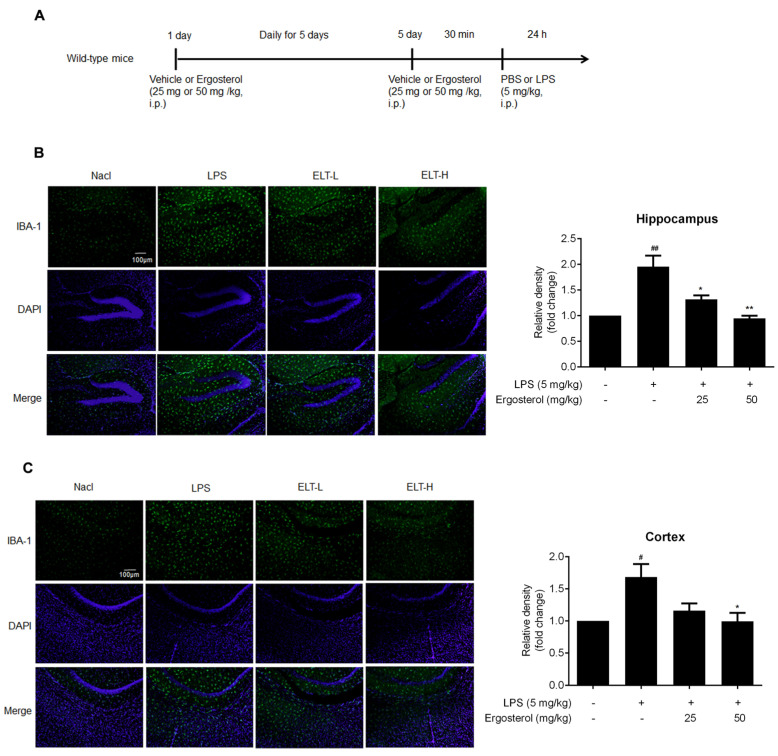
Figure 4
Ergosterol markedly decreased LPS-stimulated microglial…
Figure 4
Ergosterol markedly decreased LPS-stimulated microglial activation and inflammation in ICR mice. ( A…
Figure 4 Ergosterol markedly decreased LPS-stimulated microglial activation and inflammation in ICR mice. (A) ICR mice were injected daily with Ergosterol (25 mg/kg, 50 mg/kg, i.p.) or vehicle (PBS, i.p.) for 5 days, followed by LPS (5 mg/kg, i.p.) or PBS injected for 24 h. The mice were then perfused and fixed. (B,C) An anti-IBA-1 antibody was used for immunohistochemistry. Quantification of IBA-1 fluorescence strength in the cerebral cortex or hippocampus (Nacl, n = 8 mice; LPS, n = 8 mice; Ergosterol 25 mg/kg + LPS is marked as ELT-L, n = 8 mice; Ergosterol 50 mg/kg + LPS is marked as ELT-H, n = 8 mice). (D,E) The mRNA levels of the IL-1β, IL-6, TNF-α, and INOS inflammatory factors in the cortex and hippocampus of the mice were measured with qRT-PCR. (F) The p-P65, IL-6, and IBA-1 protein levels were determined by Western blot. Actin was used as a housekeeping control (Nacl, n = 3 mice; LPS, n = 3 mice; ELT-L, n = 3 mice; ELT-H, n = 3 mice). (G) The relative expression level of protein to actin was calculated by densitometry. (H,I) The protein levels of IL-1β and IL-6 in plasma were detected by ELISA. (J) The expression levels of NO in plasma were detected with a Griess assay. Statistical significance was analyzed using one-way ANOVA and t test. # Significantly different from the control; * significantly different from the LPS-treated group. Significance: # p < 0.05, ## p < 0.01, ### p < 0.001, #### p < 0.0001, * p < 0.05, ** p < 0.01, *** p < 0.001, and **** p < 0.0001.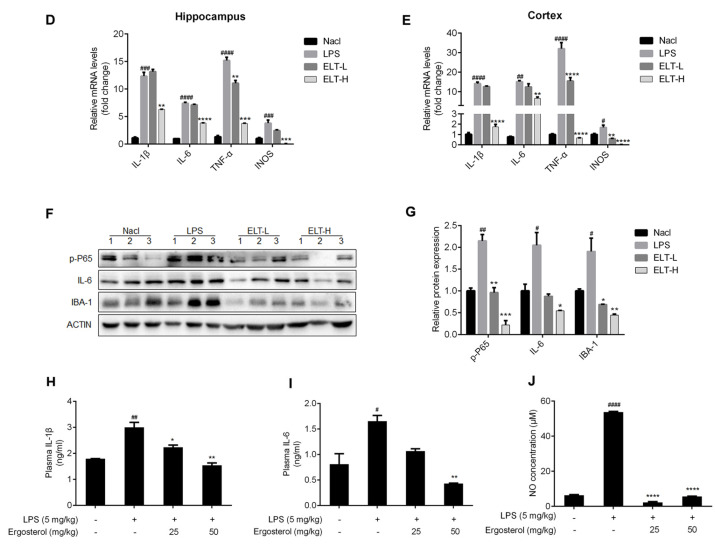
Figure 4
Ergosterol markedly decreased LPS-stimulated microglial…
Figure 4
Ergosterol markedly decreased LPS-stimulated microglial activation and inflammation in ICR mice. ( A…
Figure 4 Ergosterol markedly decreased LPS-stimulated microglial activation and inflammation in ICR mice. (A) ICR mice were injected daily with Ergosterol (25 mg/kg, 50 mg/kg, i.p.) or vehicle (PBS, i.p.) for 5 days, followed by LPS (5 mg/kg, i.p.) or PBS injected for 24 h. The mice were then perfused and fixed. (B,C) An anti-IBA-1 antibody was used for immunohistochemistry. Quantification of IBA-1 fluorescence strength in the cerebral cortex or hippocampus (Nacl, n = 8 mice; LPS, n = 8 mice; Ergosterol 25 mg/kg + LPS is marked as ELT-L, n = 8 mice; Ergosterol 50 mg/kg + LPS is marked as ELT-H, n = 8 mice). (D,E) The mRNA levels of the IL-1β, IL-6, TNF-α, and INOS inflammatory factors in the cortex and hippocampus of the mice were measured with qRT-PCR. (F) The p-P65, IL-6, and IBA-1 protein levels were determined by Western blot. Actin was used as a housekeeping control (Nacl, n = 3 mice; LPS, n = 3 mice; ELT-L, n = 3 mice; ELT-H, n = 3 mice). (G) The relative expression level of protein to actin was calculated by densitometry. (H,I) The protein levels of IL-1β and IL-6 in plasma were detected by ELISA. (J) The expression levels of NO in plasma were detected with a Griess assay. Statistical significance was analyzed using one-way ANOVA and t test. # Significantly different from the control; * significantly different from the LPS-treated group. Significance: # p < 0.05, ## p < 0.01, ### p < 0.001, #### p < 0.0001, * p < 0.05, ** p < 0.01, *** p < 0.001, and **** p < 0.0001.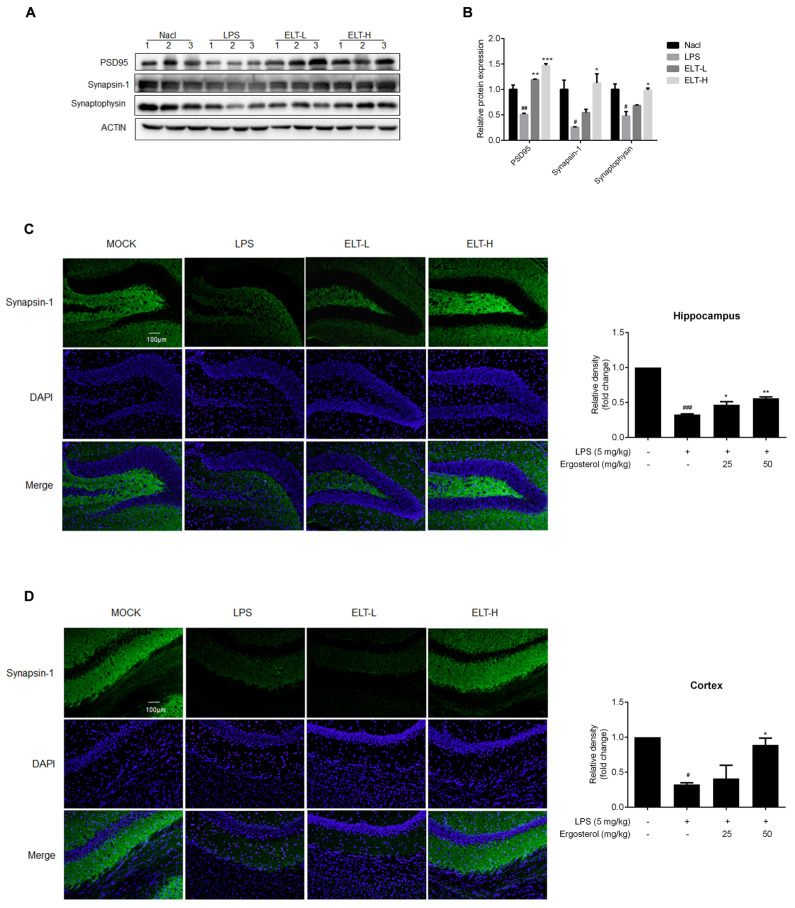
Figure 5
Ergosterol significantly reduced LPS-induced neuron…
Figure 5
Ergosterol significantly reduced LPS-induced neuron injury in ICR mice. ( A ) The…
Figure 5 Ergosterol significantly reduced LPS-induced neuron injury in ICR mice. (A) The PSD95, Synapsin-1, and Synaptophysin protein levels in the cortex of mice were determined by Western blot. Actin was used as a housekeeping control (Nacl, n = 3 mice; LPS, n = 3 mice; ELT-L, n = 3 mice; ELT-H, n = 3 mice). (B) The densitometric method was used to estimate the relative expression of the protein compared to actin. (C,D) Immunohistochemistry was performed on anti-Synapsin-1 antibody. DAPI was used as a marker of the nucleus. Quantification of the relative fluorescence strength of Synapsin-1 in the region of the cortex or hippocampus was analyzed (Nacl, n = 8 mice; LPS, n = 8 mice; ELT-L, n = 8 mice; ELT-H, n = 8 mice). All data are mean ± SEM of triplicate values. Statistical significance was analyzed using one-way ANOVA and t test. # Significantly different from the control; * significantly different from the LPS-treated group. Significance: # p < 0.05, ## p < 0.01, ### p < 0.001, * p < 0.05, ** p < 0.01, and *** p < 0.001.