Application of response surface methodology and quantitative NMR for the optimum extraction, characterization, and quantitation of Antrodia cinnamomea triterpenoids
Figures
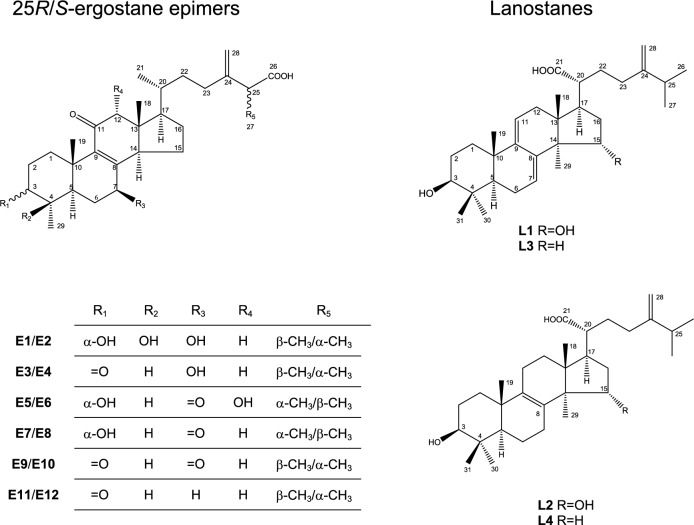
Figure 1
The ergostane epimers and lanostane…
Figure 1
The ergostane epimers and lanostane triterpenoids.
Figure 1 The ergostane epimers and lanostane triterpenoids.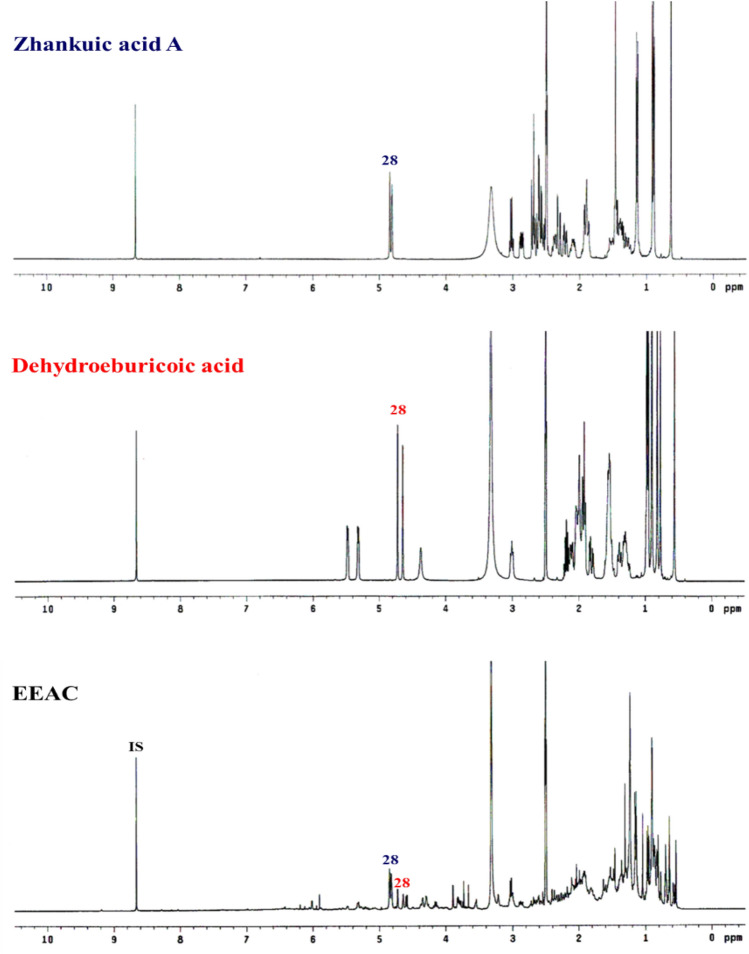
Figure 2
Plot and comparison of 1…
Figure 2
Plot and comparison of 1 H NMR profiles of EEAC, zhankuic acid A,…
Figure 2 Plot and comparison of 1H NMR profiles of EEAC, zhankuic acid A, and dehydroeburicoic acid (400 MHz).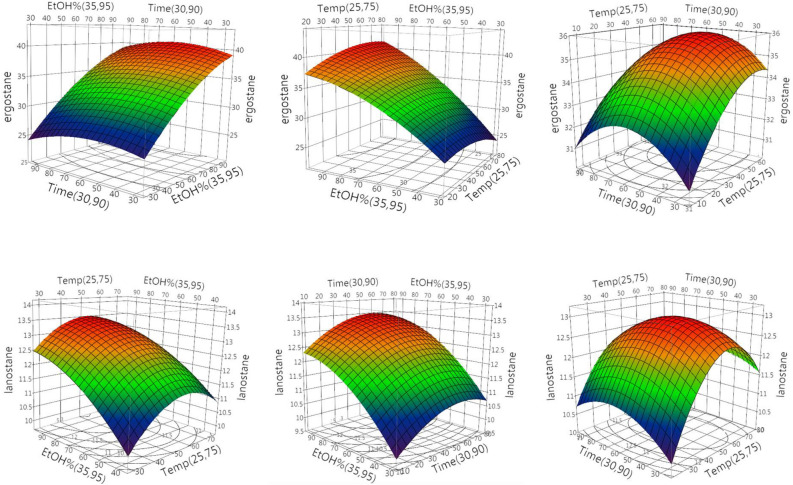
Figure 3
The three-dimensional response surface profiles…
Figure 3
The three-dimensional response surface profiles of the integration area ratios of EEAC total…
Figure 3 The three-dimensional response surface profiles of the integration area ratios of EEAC total ergostane and lanostane triterpenoids affected by three independent variables.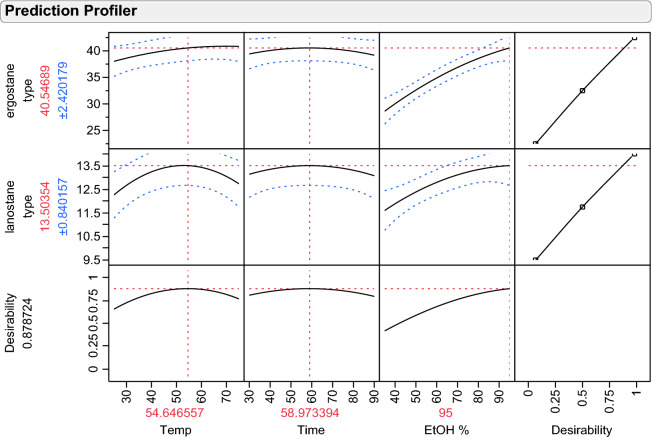
Figure 4
The prediction profile of the…
Figure 4
The prediction profile of the optimized extraction conditions of each factor utilizing the…
Figure 4 The prediction profile of the optimized extraction conditions of each factor utilizing the central composite design.