Apoptotic Cell Death and Inhibition of Wnt/β-Catenin Signaling Pathway in Human Colon Cancer Cells by an Active Fraction (HS7) from Taiwanofungus camphoratus
Figures
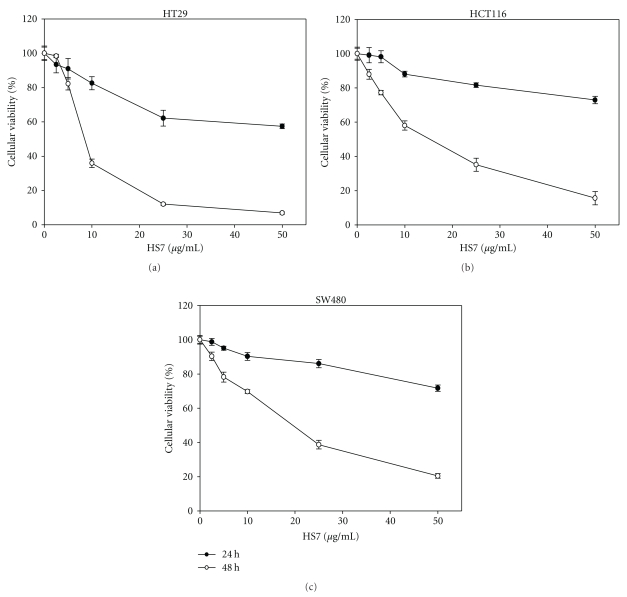
Figure 1
HS7 inhibited colon cancer cell…
Figure 1
HS7 inhibited colon cancer cell proliferation in a dose- and time-dependent manner in…
Figure 1 HS7 inhibited colon cancer cell proliferation in a dose- and time-dependent manner in 3 cell lines: (a) HT29, (b) HCT116, and (c) SW480. Cells were treated with HS7 at a final concentration of 0–50 μg/mL for 24 h and 48 h (the control group was treated with DMSO at concentration of <0.05%). Cell proliferation was determined by SRB assay. Results for the means of cell proliferation (%) ± SD of triplicate measurements are shown (*P < .01 compared with control).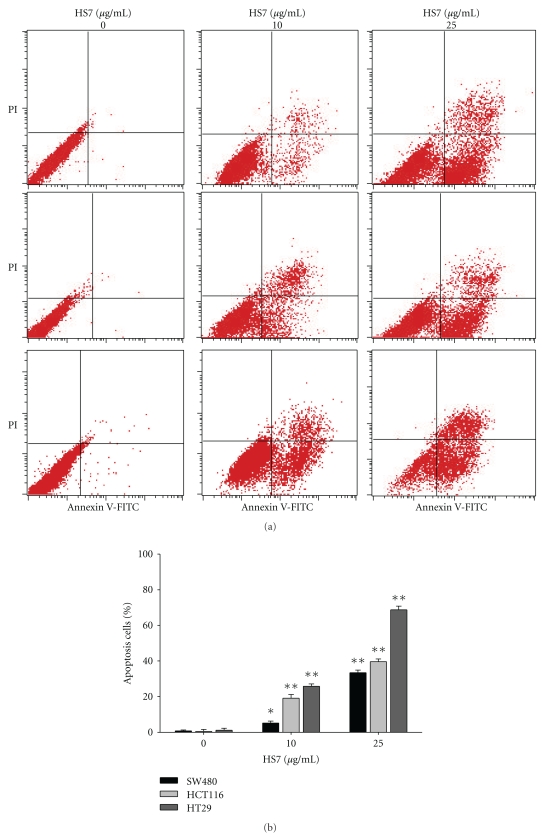
Figure 2
HS7 induced apoptosis in human…
Figure 2
HS7 induced apoptosis in human colon cancer cells. (a) SW480, HCT116, and HT29…
Figure 2 HS7 induced apoptosis in human colon cancer cells. (a) SW480, HCT116, and HT29 cells were treated with a range of HS7 (0, 10, and 25 μg/mL) for 48 h. Cells then were stained with annexin V/propidium iodide (PI) and analyzed by flow cytometry. Apoptotic cells were localized in the lower right (early apoptosis) and upper right (late apoptosis) quadrants of the dot-plot graph using annexin V versus PI. (b) Bar graphs represent the mean values of triplicate measurements ± SD. *P < .05; **P < .01, compared with control.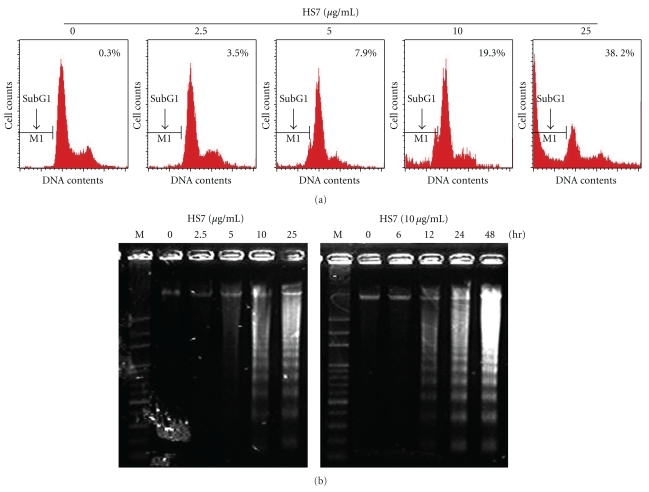
Figure 3
Apoptosis induced by HS7 in…
Figure 3
Apoptosis induced by HS7 in HT29 cells. (a) HS7 increased the subG1 population…
Figure 3 Apoptosis induced by HS7 in HT29 cells. (a) HS7 increased the subG1 population in HT29 cells. HT29 cells were grown in the absence (control) or presence of HS7 (2.5–25 μg/mL) for 48 h, stained with propidium iodide (PI), and analyzed by flow cytometry for DNA content. Arrows indicate predicted location of fragmented DNA or subG1 population. (b) DNA fragmentation of HT29 cells exposed to HS7 is shown. Genomic DNA was extracted from HS7-treated HT29 cells and separated on 1.8% agarose gels.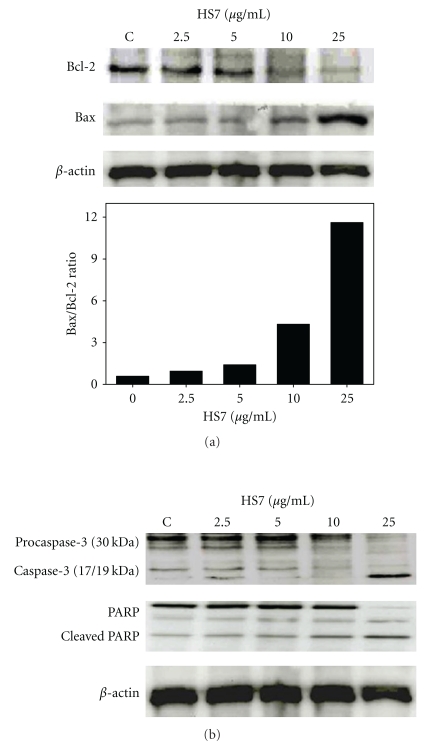
Figure 4
HS7 regulated expression of specific…
Figure 4
HS7 regulated expression of specific proteins in HT29 cells involved in apoptosis. (a)…
Figure 4 HS7 regulated expression of specific proteins in HT29 cells involved in apoptosis. (a) Protein expression of Bax and Bcl-2 and Bax/Bcl-2 ratio were shown. HT-29 cells were exposed to 2.5–25 μg/mL of HS7 for 48 h. Bax and Bcl-2 expression was determined by Western blot. Relative changes in Bcl-2 and Bax protein bands were measured using densitometric analysis. (b) HS7 induced caspase-3 activation and cleaved PARP in HT29 cells. Typical results from 3 independent experiments were shown.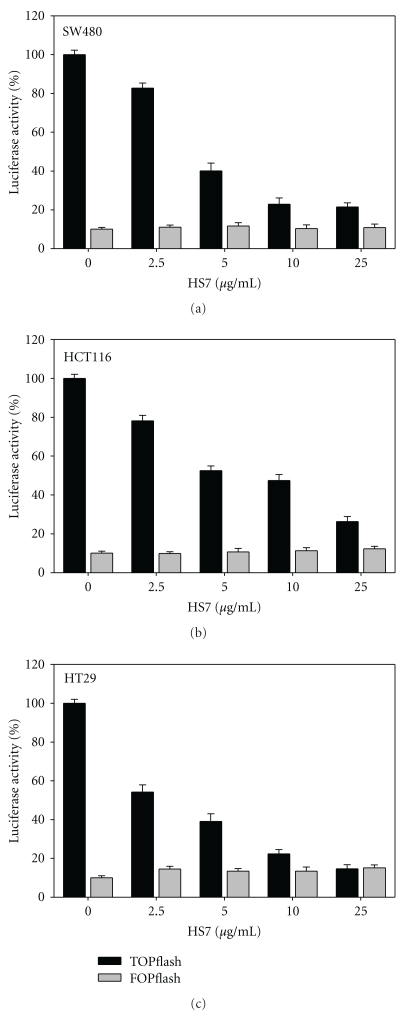
Figure 5
HS7 inhibited the transcriptional activity…
Figure 5
HS7 inhibited the transcriptional activity of beta-catenin/Tcf in colon cell lines. (a) SW480,…
Figure 5 HS7 inhibited the transcriptional activity of beta-catenin/Tcf in colon cell lines. (a) SW480, (b) HCT116, and (c) HT29 cells were transiently cotransfected with TOPflash or FOPflash and Renilla pRL-TK reporter plasmids by Lipofectamine 2000. Six hours after transfection, cells were treated with 0, 2.5, 5, 10, and 25 μg/mL HS7 for 48 h. Relative luciferase activity was normalized by transfection efficiency as determined by Renilla luciferase activity.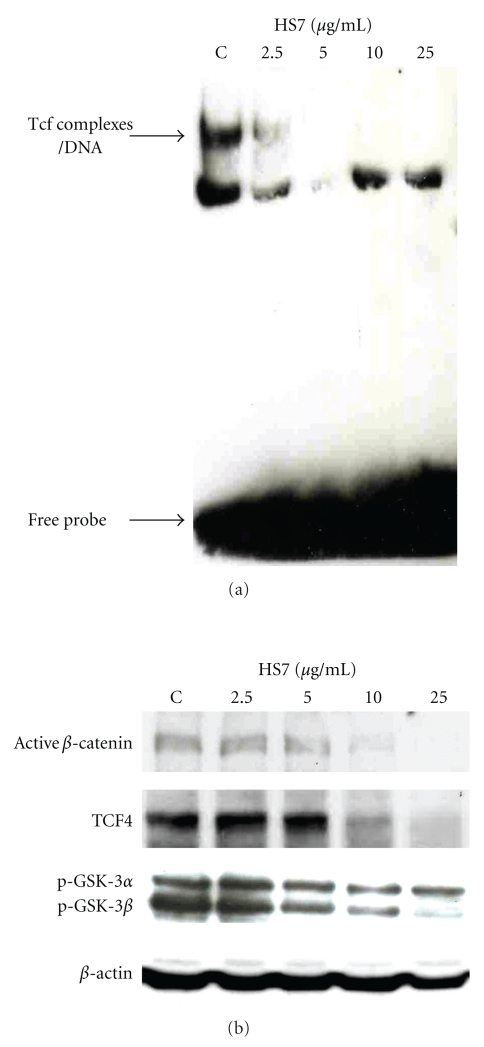
Figure 6
HS7 dose-dependently decreased the binding…
Figure 6
HS7 dose-dependently decreased the binding of Tcf complex to DNA and downregulated the…
Figure 6 HS7 dose-dependently decreased the binding of Tcf complex to DNA and downregulated the protein levels of active β-catenin, Tcf-4, and p-GSK3α/β. (a) HT-29 cells were treated with HS7 at the indicated concentrations for 48 h, and nuclear extracts were isolated. The electrophoretic-mobility gel shift assay (EMSA) was performed with 5 μg nuclear extracts. (b) HT-29 cells were treated with HS7 (0–25 μg/mL) for 48 h, the changes of active β-catenin, Tcf-4, and p-GSK3α/β protein levels were then analyzed by Western blot. β-actin was used as internal control. All pictures are representative of two independent experiments.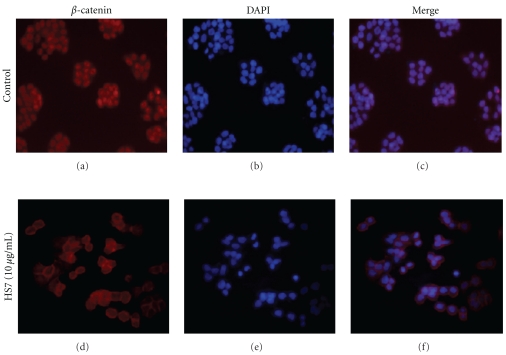
Figure 7
Effect of HS7 on cellular…
Figure 7
Effect of HS7 on cellular localization of β -catenin in HT-29 cells was…
Figure 7 Effect of HS7 on cellular localization of β-catenin in HT-29 cells was shown. Cellular localization of β-catenin was evaluated by indirect immunofluorescence using a monoclonal antibody that labeled β-catenin. Immunofluorescence labeling of β-catenin in cells treated with vehicle (a) or 10 μg/mL HS7 (c) for 48 h were shown (red). Nuclei in cells treated with vehicle (b) or 10 μg/mL HS7 (d) for 48 h were counterstained with 4′, 6-diamidino-2-phenylindole (blue). Merged images show that the β-catenin protein located at cell-cell contacts in HS7-treated cells was significantly increased as compared to control (e and f). Magnification for each representative picture: 200x (from 3 separate experiments).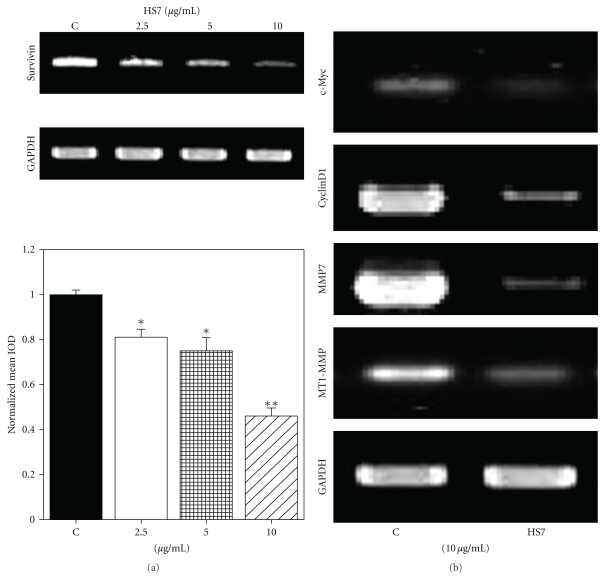
Figure 8
Inhibitory effects of HS7 on…
Figure 8
Inhibitory effects of HS7 on the expressions of Tcf/ β -catenin downstream genes…
Figure 8 Inhibitory effects of HS7 on the expressions of Tcf/β-catenin downstream genes in HT29 cells. (a) Cells were treated with HS7 (2.5–10 μg/mL) for 48 h. Survivin mRNA expression was evaluated by RT-PCR. Densitometric analysis of RT-PCR results normalized to GAPDH was shown as bar graph. Results represent the mean of 3 experiments ± SD. (b) Cells were exposed to 10 μg/mL HS7 for 48 h, and the expressions of c-Myc, CyclinD1, MMP7, and MT1-MMP mRNAs were evaluated by RT-PCR. *P < .05; **P < .01 compared with control.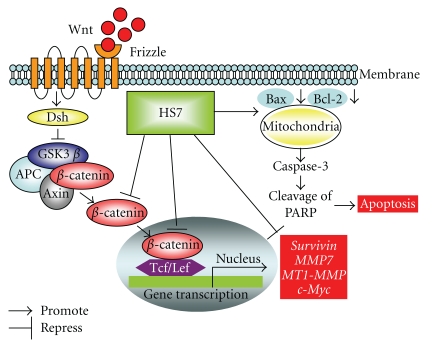
Figure 9
Hypothetical diaphragm of HS7 induced…
Figure 9
Hypothetical diaphragm of HS7 induced apoptosis and inhibition of Wnt/ β -catenin signaling…
Figure 9 Hypothetical diaphragm of HS7 induced apoptosis and inhibition of Wnt/β-catenin signaling pathway in HT-29 colon cancer cells. The arrow indicates promotion, and the T-shaped bar indicates repression. Dsh: dishevelled protein, GSK-3β: glycogen synthase kinase-3 beta, APC: adenomatous polyposis coli protein, Tcf/Lef: T-cell factor/lymphocyte enhancer factor family, PARP: poly (ADP-ribose) polymerase. All figures (9)